The 2 DAY RSI Indicator
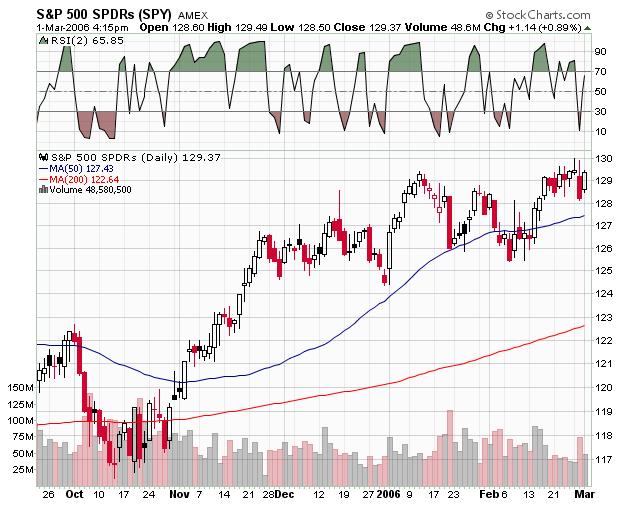 Above is a large chart of the SPY with a crisp RSI indicator above the chart set at 2 days. One can see how useful this trading method can be. If one were to buy the SPY when the RSI indicator was near 10 and sell the SPY when the inidicator was near 90, one would have done rather well . Of course it is always hard to buy when the price is low and their is fear that the price is going lower. Most prefer to buy when stocks are moving up and appear to be going higher. I think the picture above is worth many words. A good system that can maintain a buy low sell high discipline.
posted by DAVID at
6:38 PM
![]()


1 Comments:
Not uncommon
Post a Comment
Subscribe to Post Comments [Atom]
<< Home