MARKET GRUMBLINGS

 I was reading an article on Tradingmarkets.com earlier this morning about some worries over the recent market breath numbers, so I decided to a little homework. The chart immediately above shows about 320 stocks in the SP500 currently trading above their 50 day SMA. This is in great contrast to back in December of 2005 when the SP500 index was lower and their were over 420 stocks trading above their 50 day SMA. What exactly does this mean? It is an indication that fewer and fewer stocks are participating in the recent market advance ( energy and commodities).
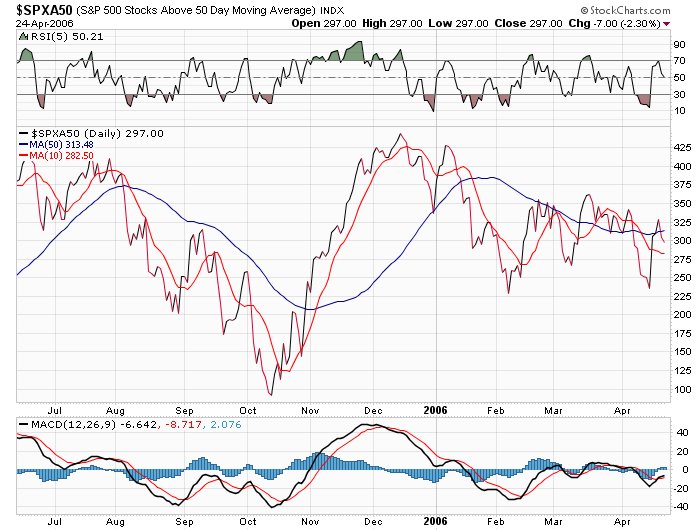
In addition if one looks closely at the SP500 chart, the momentum indicators continue to roll over as the index goes higher. Another sign of an impending market downturn as the momentum indicators are leading and generally forecast a change of direction before it actually happens. This is a clear negative divergence in the SP 500 chart.
posted by DAVID at
7:17 AM
![]()


0 Comments:
Post a Comment
Subscribe to Post Comments [Atom]
<< Home