ONE OTHER THING
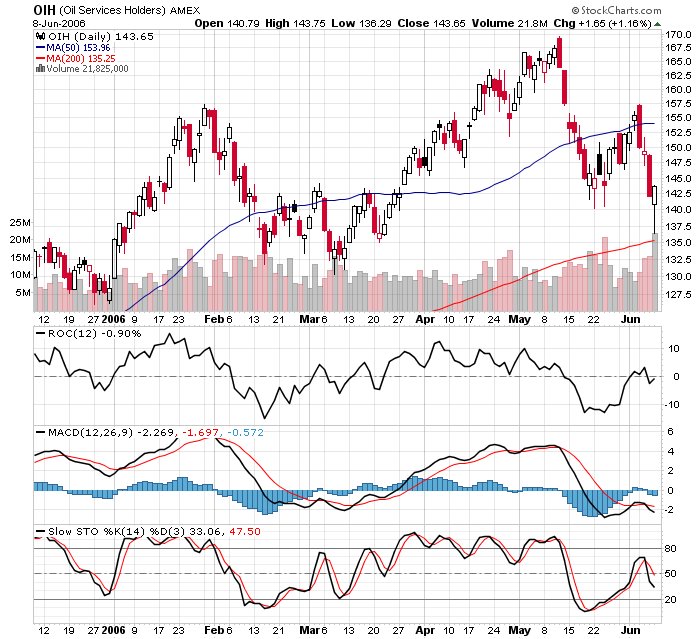 As I sift through various ETF charts, the same patterns seem to show over and over. Retest of the prices but much higher lows on the Momentum indicators. The Oil Services Holder ETF chart above has a very similar pattern to the SPX pattern, and yesterday if one were watching the charts closely, the OIH was the first ETF to turn. Noon yesterday, the OIH hit bottom at 136 an climbed in a straight line higher all afternoon finally stopping at the 143 area. This morning it appears to be up another $1.5 so hopefully the pattern continues and the SPY also continues higher. I also stand by the old adage that higher prices in the Oil services sector/Oil yields higher prices in the major market indexes.
posted by DAVID at
8:05 AM
![]()


2 Comments:
I don't mean to shake anyone's trade; Long seems to be crowded. Be sure your stops are set.
-
One has three choices - long, short or stand aside
Post a Comment
Subscribe to Post Comments [Atom]
<< Home