SAME OLD STORY
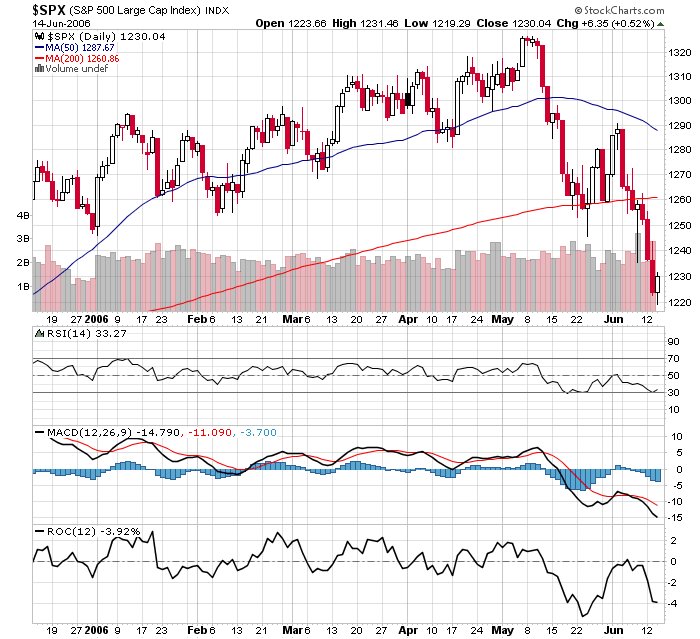
The chart looks the same after today's bounce as the Bullish Divergence remains in place on the MACD Histogram and the Rate of Change indicators. The rehash, lower levels on the price of the SPX and higher lows on the MACD Histogram and Rate of Change indicators. I want more evidence and any bounce up to the 1260 area will be sold big time by everyone in my humble humble opinion. However, lets get there first.
posted by DAVID at
4:46 PM
![]()


3 Comments:
Some other interesting items from the dailies - the vix formed a bearish harami. This generally signifies an improving market.
I don't know if you follow the hour charts but I like to see the last hour as a big white candle for the 3 sisters (DIA, SPY, QQQQ)which it was today. Suggests that tomorrow morning at least should be up.
My cycle is buy at 3:45 sell at 9:45. I hold risk overnight but it is the only thing that has worked consistently for the past several months. So I really want the market to drop during the day - makes my entry that much sweeter.
historically, selling at 9:00 and buying back at 10:30 works really well. (backtested).
-Tom
Post a Comment
Subscribe to Post Comments [Atom]
<< Home