TECHNICALS-SPY

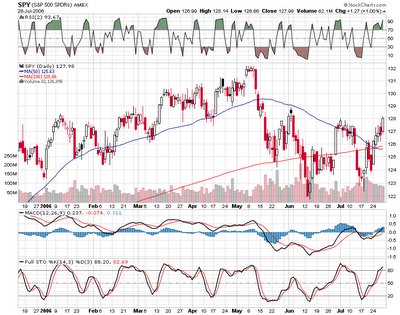
 Checking the numbers on the SPY, the ETF is in overbought territory, 2 day RSI of 94 and both MACD and FULL Stochastics giving overbought readings.
The obvious area of resistance is SPY 128 (current quote) and the high from early July; with the next resistance level being 129, the high from early June.
The 50 day and the 200 day SMA's of the SPY are both upward sloping (barely) and below the current quote, and the 50 is below the 200. So some obvious overbought signals, but it still may have some room to run with the seasonally strong next few days and the new trend up.
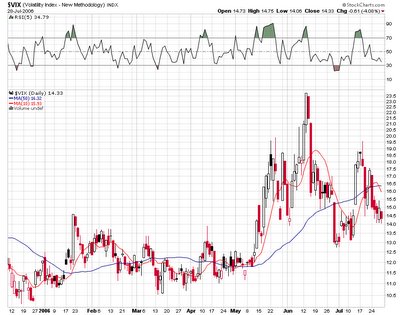
VIX also giving the same overbought SPY signal as it trades at 14.33 and 10% below its 10 day SMA. If you take a close look at the chart, it is apparent that the VIX has traded in a range between 13 and 19, so selling at 14.3 is probably not a terrible idea; if you didn't sell, monitor the price closely with tight stops.
Another sell signal developed by Larry Connors from TradingMarkets.com is the reading of the 5 period RSI of the VIX. According to Larry, when the number is under 30, its a good time to sell and the current reading is 35, so close but not yet.


1 Comments:
Good tip re Conners RSI(5) on VIX.
Thanks for mentioning it.
Cheers
Anthony
Post a Comment
Subscribe to Post Comments [Atom]
<< Home