TECHNICALS-SPX
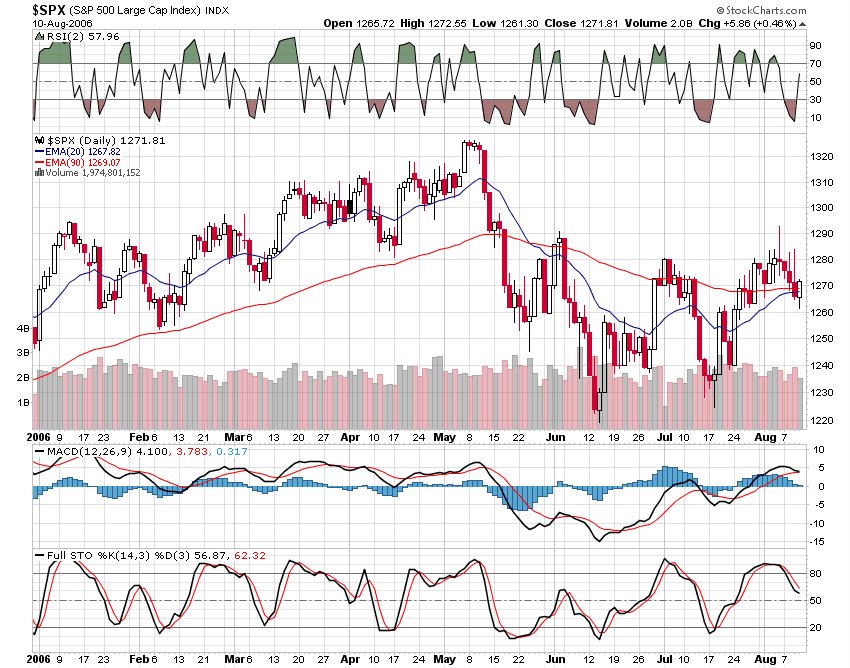
Checking the SPX chart, support appears to be the 1260 area (50 day EMA) and resistance seems to be at 1280 and 1290. Right now, smack in the middle at 1270 and its an August Friday, so don't expect much movement.
MACD Histogram looks to be rolling over (negative divergence) along with Stochastics, so don't be surprised by lower prices next week. Unless we get more RESILIENCE of course.
posted by DAVID at
12:50 AM
![]()


0 Comments:
Post a Comment
Subscribe to Post Comments [Atom]
<< Home