TECHNICALS-SPX

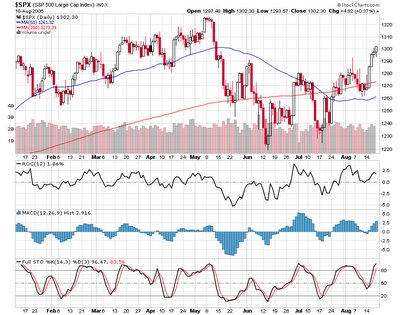
The SPX chart is looking a bit toppy ( as it often does during major rallies) with the MACD Histogram and the Rate of Change indicator making lower highs as the markets continue to drift up. Typically the negative divergence is a warning sign of lower prices but so far the markets have refused any significant pullback.
The Volatility indexes also appear to be headed for single digits but as Adam points out, that is somewhat related to the time of year and the upcoming holiday.


0 Comments:
Post a Comment
Subscribe to Post Comments [Atom]
<< Home