TECHNICALS-SPX
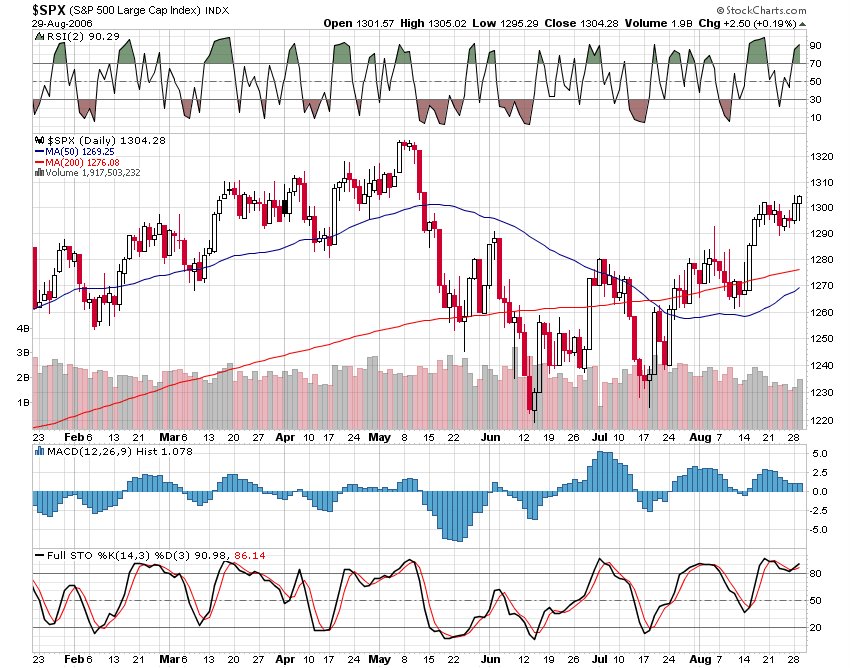
Markets closed near their highs yesterday but the technicals on the SPX chart are still giving a bit of a bronx cheer to the rally.
Notice how as the SPX continues to make higher highs, the MACD Histogram continues to make lower highs on each climb.
Stochastics still overbought, but note again a lower high on the markets newest higher high.
The 2 day RSI also overbought at the plus 90 reading.
My basic little ETF strategy, buy (scaling in) the major market indexes when RSI level hits near the 10 level and sell them (scaling out) when they get over 80; and if the Volatility indexes confirm the buy and sell signals as they get overbought or oversold (10% above/below the 10 day SMA's) so much the better.
Trading markets (available for free from the site) has an analysis of a similar system and it is a consistent winner following a buy lower sell higher philosophy.
posted by DAVID at
7:52 AM
![]()


0 Comments:
Post a Comment
Subscribe to Post Comments [Atom]
<< Home