TECHNICALS-QQQQ
 Similar pattern on the QQQQ chart as the SPX as the ROC indicator is much lower than where it was when the QQQQ price was lower and MACD Histogram also lower and downtrending as the price is higher. This is the same negative/ bearish divergence that was on the SPX. Also, note the gap that remains to be filled at the 37.75.
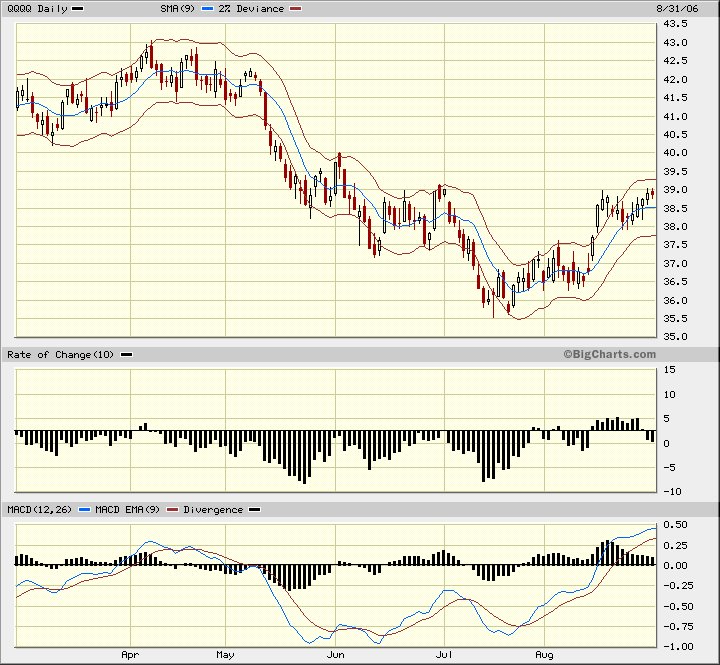
So with all the "new blah blah high" chatter on bubblevision, we have similar or slightly higher prices to two weeks ago but falling momentum indicators.
posted by DAVID at
8:15 AM
![]()


0 Comments:
Post a Comment
Subscribe to Post Comments [Atom]
<< Home