TECHNICALS-GS/SPX

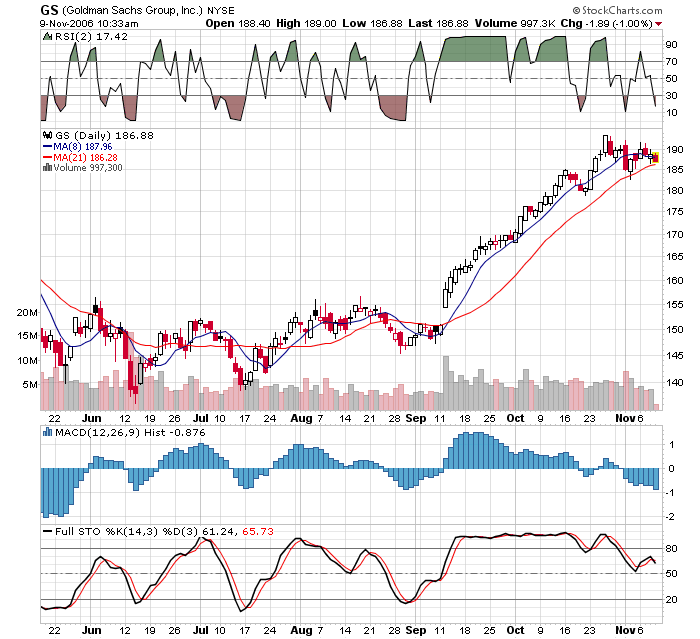 There, you have the SPX chart and a chart of GS, now I have no clue if there is any correlation, but I do know that GS had been doing great until about 10 days ago when it hit a wall at approximately the 195 level. The SPX also hit a wall at the 1,390 level and retraced but has since recovered. So I have no great answer, but it seems odd that the SPX has gotten back to the old highs while GS has not. FWIW.
posted by DAVID at
11:02 AM
![]()


0 Comments:
Post a Comment
Subscribe to Post Comments [Atom]
<< Home