More Volatility Trading
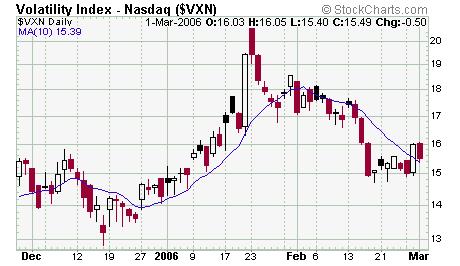
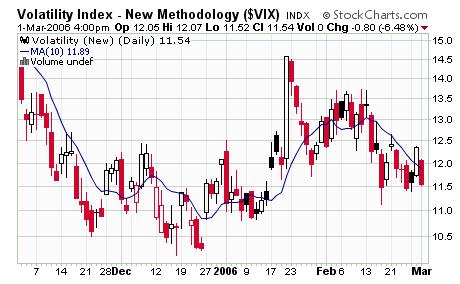 The above charts are 3 month charts of the VIX and VXN the volatility indexes of the SP 500 and the Nazdaq 100 respectively. The 10 day SMA of the VIX is 11.81 and the sell area (10 % below the SMA) is approximately 10.65 as of today, so there may still be more upside to the markets. The VXN target is approximately 14 so again further upside may be in the cards for the QQQQ. Note that these are moving averages so the targets change daily and the rules are guidelines.
posted by DAVID at
8:06 AM
![]()


1 Comments:
Great chart
Post a Comment
Subscribe to Post Comments [Atom]
<< Home