MATH
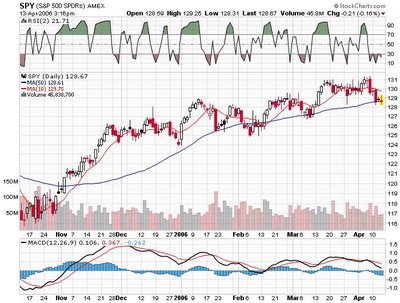
 There up above, its a six month chart of SPY. Is it an uptrend, a trading range or a the beginning of a down trend. Inquiring minds want to know; this one included.
The ETF is trading at about its still uptrending (barely) 50 day SMA and the 2 day RSI is at about the 20 level.
The VIX and the VXO are still about 5% stretched from their respective 10 day SMA'S, so the indicators tell me its still time to be long.
The Pivot for Monday is should be right back at the 128.9 level and support and resistance are going to be at the 128.3 and 129.2 respectively. I plan to hold over the long weekend and look for buyers to come in on Monday.


0 Comments:
Post a Comment
Subscribe to Post Comments [Atom]
<< Home