TECHNICALS- IBB
 The ugly chart above of the IBB may represent a buying opportunity, or perhaps a put selling opportunity. Kudos to Adam at the Daily Option Report for pointing out the method and the ugly chart.
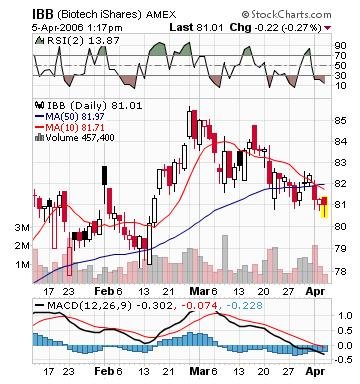
IBB is currently trading at a 2 day RSI of 14 and it's MACD Histogram is turning up under the zero line. It also may be catch up time for the Biotech stocks as they have recently underperformed the market.
If the IBB turns around and goes higher, the puts sold expire worthless and the premiums collected are kept. The method of put selling is an excellent way of getting long stock or an ETF and using as little capital as possible.
posted by DAVID at
1:50 PM
![]()


0 Comments:
Post a Comment
Subscribe to Post Comments [Atom]
<< Home