ANOTHER SIGNAL?
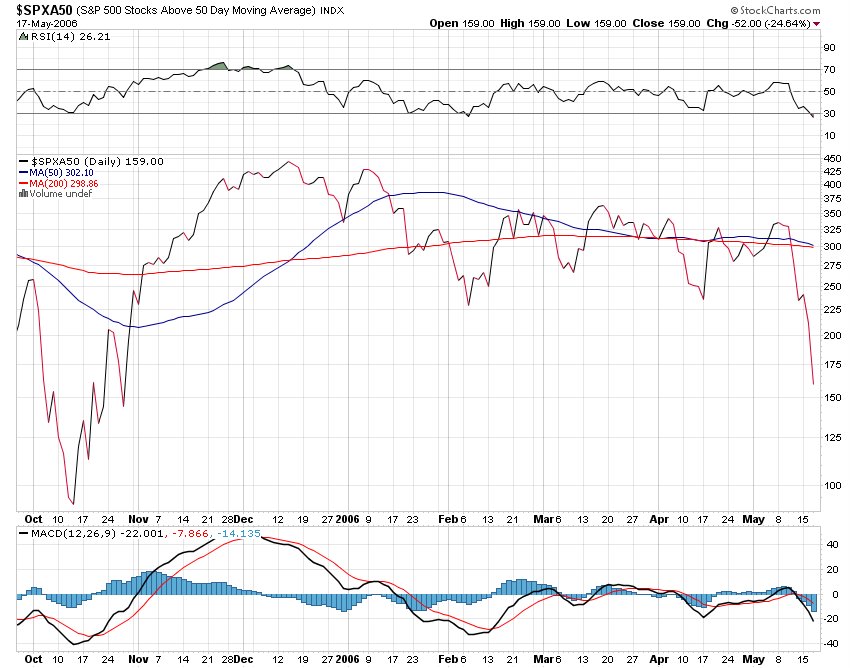 Looking at this chart, well it shows the same thing that all the other charts are showing, the markets are oversold and due for a bounce. This chart shows that the number of SPX stocks trading over their 50 day SMA is now down to 159, which is down from over 300 just a few days ago. If 60 more issues break down we are right back at the October lows on this indicator. At the rate we are falling, could happen tomorrow.
posted by DAVID at
8:51 PM
![]()


0 Comments:
Post a Comment
Subscribe to Post Comments [Atom]
<< Home