HERE FIRST
 Back at the end of April, I wrote a piece called Market Grumblings, where I discussed the Negative Divergence that the equity markets were making. A negative divergence occurs when an equity such as SPY makes a higher high and a momentum indicator such as MACD makes a lower high. If you look at the above chart, you will see that MACD made its high back in the November/December time frame but the markets made their highs in the middle of May.
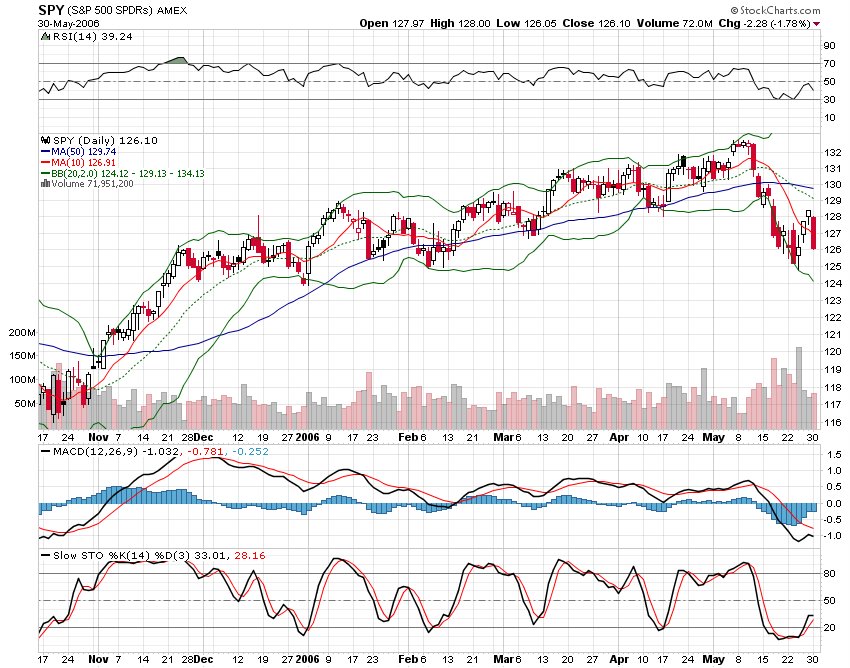
The reason that a negative divergence occurs is because markets will start pulling back more often as they run out of upside momentum. Hence the prices may be higher than they were, but the momentum indicators will not. Check out the MACD Histogram above as the markets started losing their momentum over the last few months as the pullbacks increased in frequency.
We may now have the reverse as the SPY went straight down from 133 to the 125 level. It rallied back to 128 last week, but is now back at the 126 level after today's relentless selling. However, if the SPY gets back down to the 125 level, I feel confident that the MACD histogram and the Stochastic indicators will be at higher levels than when the SPY was at the 125 level last week. The reason being, the sharp rally Thursday and Friday caused a reduced amount of downward momentum. This could/should bring on a Positive Divergence and a bullish signal for the markets.
posted by DAVID at
7:30 PM
![]()


0 Comments:
Post a Comment
Subscribe to Post Comments [Atom]
<< Home