HISTORY
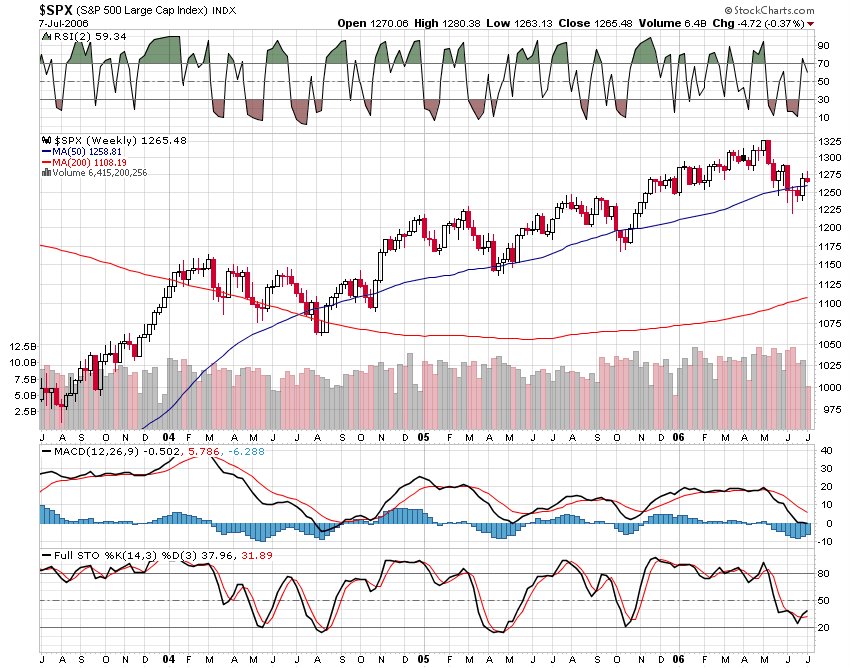
A brief history of the SPX on a longer term basis shows (daily) the moving averages of the 50 day crossed the 200 day lower in November of 2000 , recrossed higher in May of 2003 and has been in bullish mode since (50 over 200) except for a short period in the fall of 2004.
The longer term dailyand weekly charts of the SPX also continue to look bullish as one can draw a trend line at the upper channel and the lower channel and still find higher highs and higher lows. Not sure how long it will last but for now it is continues.
posted by DAVID at
8:28 PM
![]()


0 Comments:
Post a Comment
Subscribe to Post Comments [Atom]
<< Home