MORE GLOOM
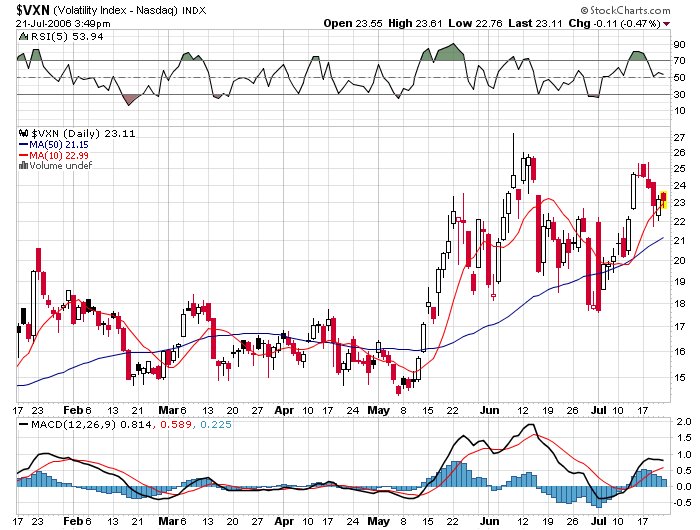
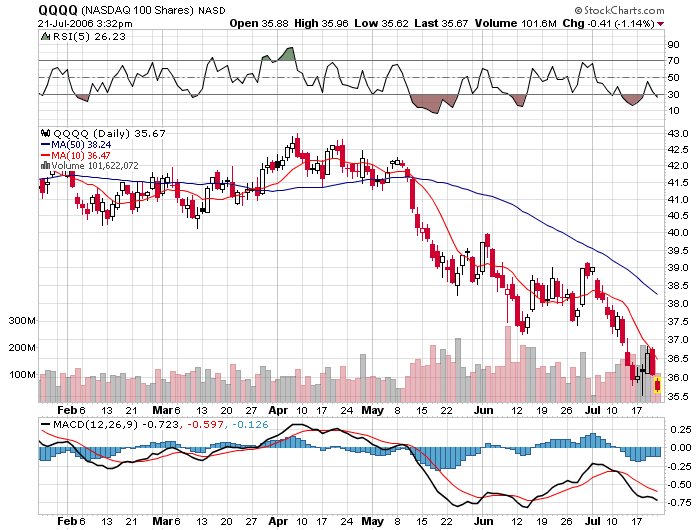 More unhappy news for the NAZ longs as a close read of the QQQQ chart along with a look at the VXN provides some interesting information. The VXN is the volatility index on the NAZ 100, so it is equivalent to looking at the SPX with the VIX.
The big red flag warning from the two charts is that the VXN was considerably higher back in mid June when the QQQQ was also much higher. In other words, there was more fear and higher put pricing surrounding the QQQQ back in June when the price was a couple of bucks higher. My logic is that if the fear becomes equivalent to the June levels, the QQQQ will be lower yet. Just a heads up for the longer term traders/investors. There is no sure thing in trading, but these charts have to be somewhat disturbing to any perma bull.
posted by DAVID at
4:04 PM
![]()


0 Comments:
Post a Comment
Subscribe to Post Comments [Atom]
<< Home