TALKING PICTURE
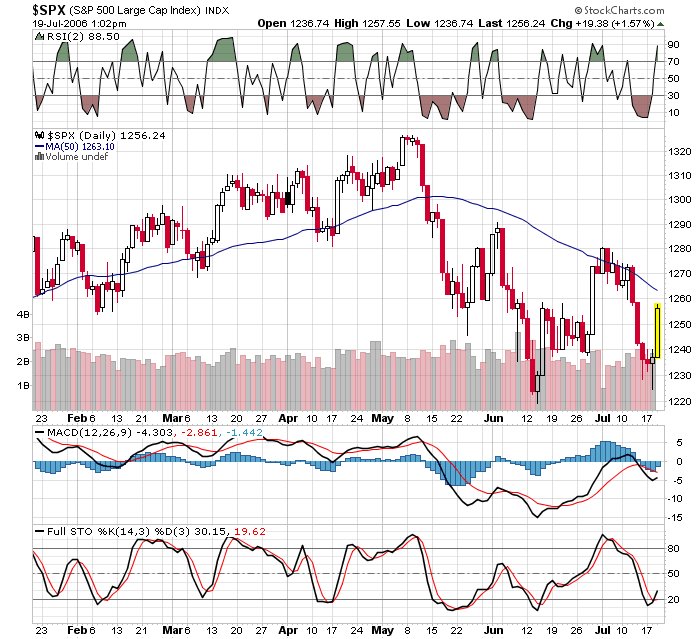
Here is a picture that is worth at least a thousand words. The 50 day SMA is the line on the chart and if you look closely you can see that when the SPX was in an uptrend, the 50 day line provided support every time it sold down. So far during the downtrend, it has held as resistance every time the SPX rallied. Food for thought as we rally to the 1258 level with the 50 day SMA just a bit higher at the 1263 level.
posted by DAVID at
1:21 PM
![]()


0 Comments:
Post a Comment
Subscribe to Post Comments [Atom]
<< Home