DRIFTING
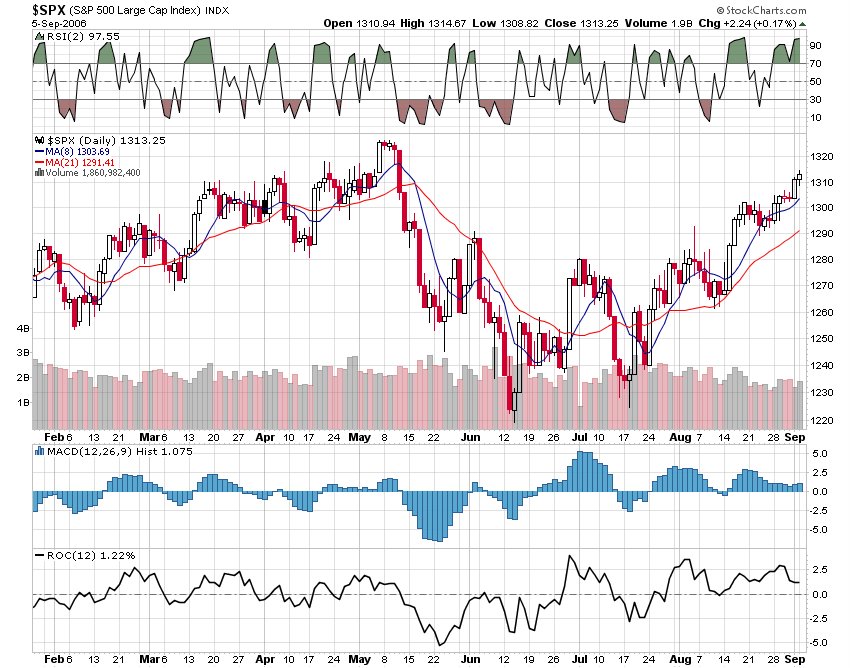 Another day of drift up action in the major indexes and another day of lower highs on MACD Histogram and ROC momentum indicators. Two leading technical analysis indicators that generally pre tell lower prices as they indicate that the market is running out of upward steam.
Volatility indexes continue to trade near their 10 day SMA's with little volatility as the slow pre Labor day trade continued ALD.
The 2 day RSI numbers on the major market indexes continue with sell signals as upper 90's and 99's prevail on just about all the major ETF's.
I am not sure what the catalyst will be for the selloff, but I am fairly certain one is coming shortly as the markets have had very few lower closes since mid July.
posted by DAVID at
7:45 PM
![]()


1 Comments:
David - an analytical method should hold over multiple time periods and this one is not appearing on the weekly charts and has been prevalent on the monthly charts for about 3 years now - or ever since this particular rally began.
It is possible that a rotation into tech is occurring which makes sense since every recession is characterized by a similar event. Managers don't want to hire people during slow downs (obviously) so they upgrade capabilities instead. It won't be a huge boom this time because there have been only incremental upgrades to tech but there is enough "old iron" lying around (small screen CRTs being just one example) that people might want to change just to give an appearance that their business is staying in touch.
Just because the economy is experiencing a recession doesn't mean businesses don't have cash to spend - and the rule is simple - spend it or lose it to the tax man.
That doesn't mean that we can't have a near term consolidation or dip but possibly not too severe.
Have a good day.
Post a Comment
Subscribe to Post Comments [Atom]
<< Home