RUDE CRUDE
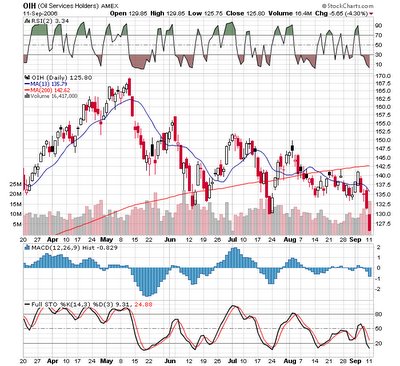
 OIH is a mighty ugly chart as the ETF hits its lowest price since last December. The volume, highest in a while also as it traded over 10 million shares today.
Now the good news, if you like to buy lower, it is now stretched about 17 points or 12% below its 200 day SMA and about $10 from its 13 day SMA. Sounds like short term way oversold to me. In addition, it gapped down today form Friday's close at 131, so probably also a gap fill play before too long.
Stochastics are hitting about the same low levels as when the OIH turned higher on the last few dips. So if one is convinced that oil stocks are a longer term buy, perhaps an area where one can start the process. Just keep some ammo available as scaling is probably the best strategy at this point.


0 Comments:
Post a Comment
Subscribe to Post Comments [Atom]
<< Home