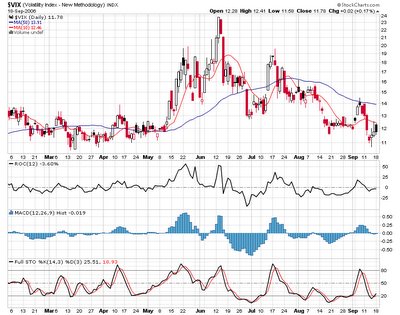
TECHNICALS-SMH

 One of the strongest sectors during the recent market rally has been the SMH, which is an ETF that invests in semiconductor stocks.
Over the past few days, however, SMH has found a brick wall at the $35 level. I note also that the ROC indicator, a momentum clue, shows a bearish divergence as higher prices on SMH are greeted by lower ROC readings. Obviously the MACD Histogram is showing the same pattern although it topped several days ago. Stochastics also showing the same property as it has ticked down on higher prices.
Notice that back in July the same properties were present but in reverse as lower prices brought higher momentum readings.


0 Comments:
Post a Comment
Subscribe to Post Comments [Atom]
<< Home