TECHNICAL INDICATIONS
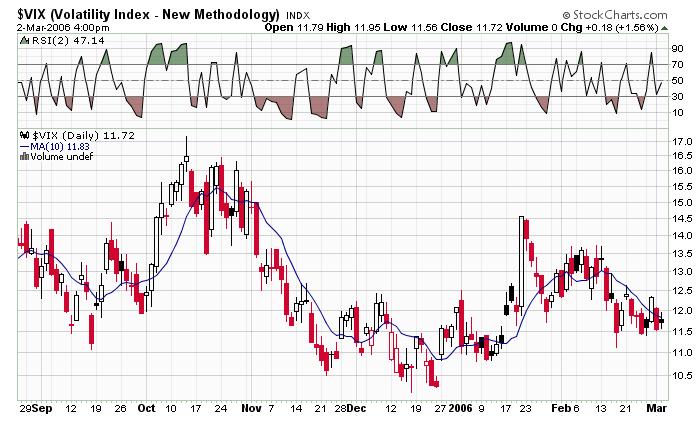
The VIX chart above tells the story (to me anyway) that the market is neither overbought nor oversold. The VIX sits just about at its 10 day SMA and the 2 day RSI is approximately 47. So hopefully we can get some jig and this index will collapse and maybe we get the sell high signal that we are seeking.
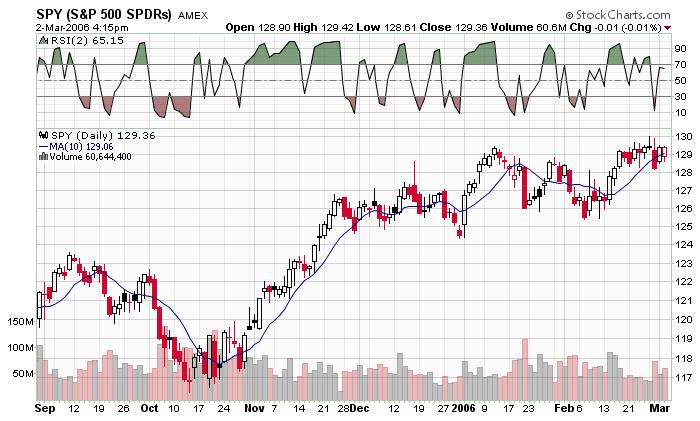
The spy chart tells a similar story as the closing price is about 30 cents higher than the 10 day SMA and the 2 day RSI is at 65. The sell signal kicks in when the 2 day RSI hits 90 or higher.
posted by DAVID at
7:51 PM
![]()


1 Comments:
Not bad
Post a Comment
Subscribe to Post Comments [Atom]
<< Home