UPDATE
 Its 3:00 AM in the east and the SPX futures are higher by 5.5 points. A little different from the 4:30 PM update yesterday afternoon when the futures were tanking on the "bird flu" news. Did not make any sense then and this will not make any sense this afternoon when I am sure this "preopen gap" gets sold down (lol). Well maybe not.
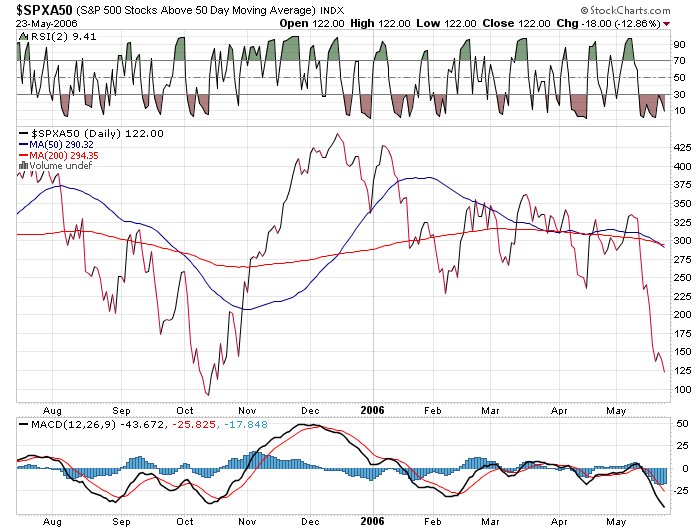
Above is a chart of the SP 500 stocks trading under their 50 day SMA. Most folks go to Worden and use their 40 day SMA chart and convert it to a percentage basis but its all the same as long as its consistent.
Bottom line is that it is way oversold, oops way way oversold and due for a bounce. I am actually thinking that this bird flu thing yesterday afternoon was the final bit of news to get the rally going. A double bottom may be in and finally a lasting rally as all the traders/investors who bought yesterday threw in the towel during the afternoon selloff. One can only hope. Oh and did I also mention that maybe Jimmy might have bottom ticked it with his call about lousy American companies. Has he not been looking at the overseas market? What a joker.
posted by DAVID at
3:10 AM
![]()


0 Comments:
Post a Comment
Subscribe to Post Comments [Atom]
<< Home