TECHNICALS - OIH
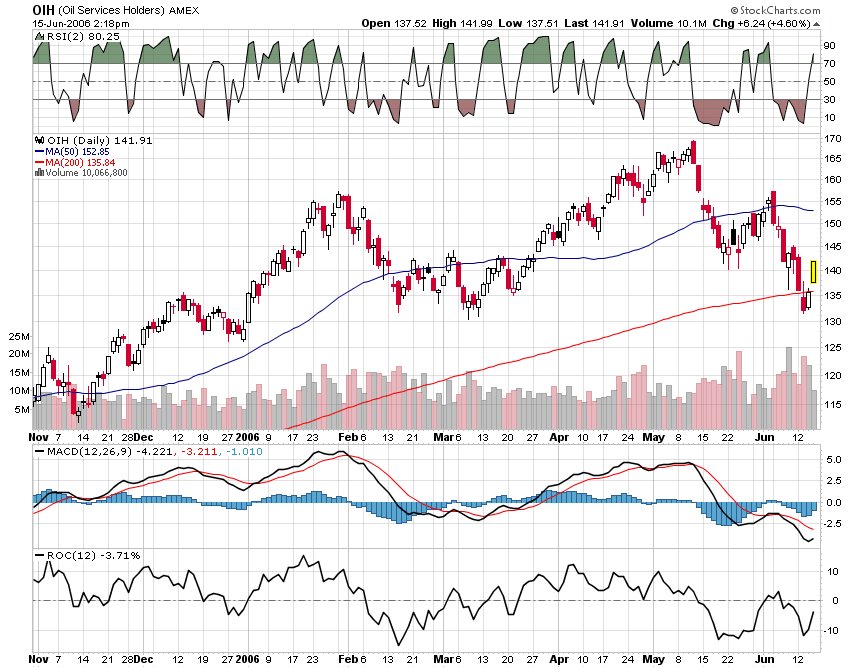
Not unlike most other charts, the OIH has also us up with a bullish divergence as the price made a lower low but the MACD Histogram and ROC momentum indicators made higher lows.
One pal (Jim) called me on Tuesday midday with the "I can't take the pain anymore" and he rang the bottom bell on the OIH, which he wanted to sell, which have ripped higher with the rest of the oil patch and equities in general.
From a trading viewpoint, it looks like the OIH could rip into the 50 day SMA area (155) with a logical stop just under the recent lows.
posted by DAVID at
2:43 PM
![]()


0 Comments:
Post a Comment
Subscribe to Post Comments [Atom]
<< Home