NUMBERS UPDATE
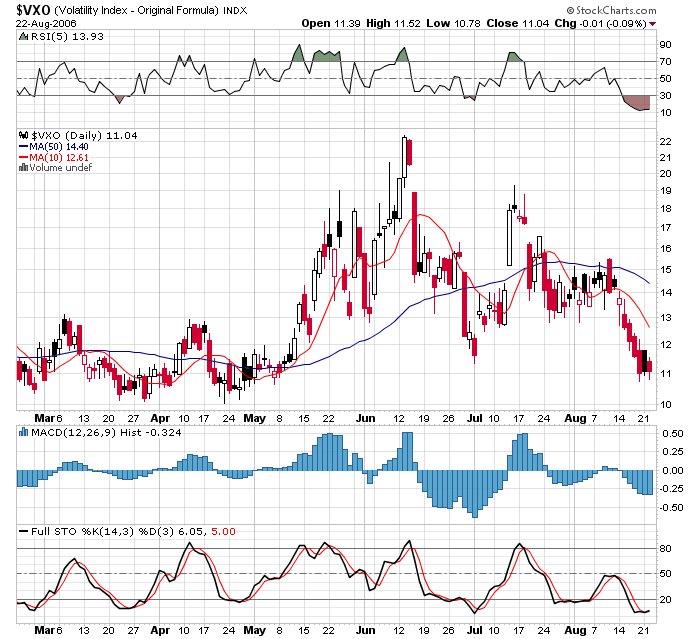
The numbers on the VXO/SPX are giving predominantly sell signals with the major one coming from the VXO being more than 10% under its 10 day moving average. In addition, the 5 day RSI of the VXO is way under 30, the general sell signal, at a low 15.
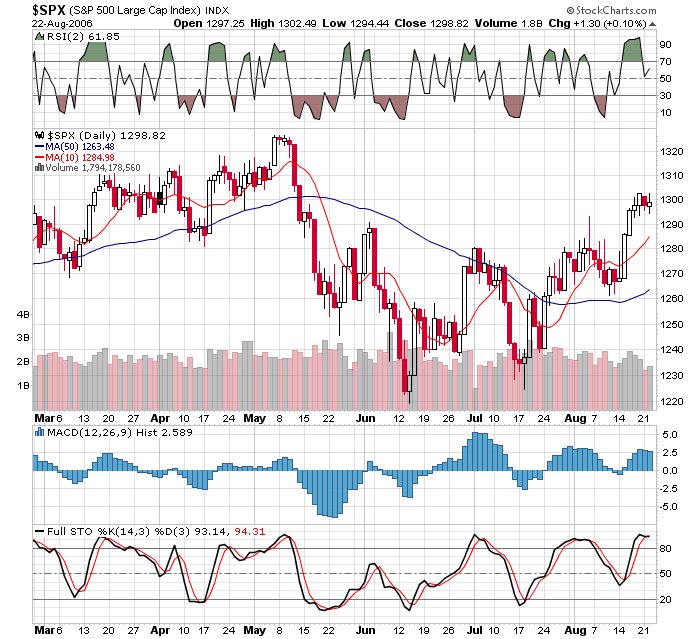
The SPX chart is also in sell mode with resistance just overhead at 1300/1305 even though the 2 day RSI is only a bit overbought short term at 62. The MACD Histogram and stochastics are quite toppy also giving a signal that we are toppy.
Today, the chart to watch is probably the SOX/SMH as the reaction to the NSM guidedown will be key. The NAZ and the SOX indexes have bounced nicely off their lows but now everyone will want to see the reaction to the bad news.
posted by DAVID at
8:09 AM
![]()


0 Comments:
Post a Comment
Subscribe to Post Comments [Atom]
<< Home