3.17.2006

PARTY LIKE ITS 1999

In light of the first day of the new Bull Market, I want everyone to party tonite like its, yes, 1999.

However, before you do, lets look at todays rip roaring rally: As I type, the SP500 is 1.5 positive, the QQQQ is flat as are the Semis, the market internals, bank stocks and the Volatility Sisters. Oils are down and standing out on the green side are the homies, the Small caps and Goldie.

STOP TRADING


NO STOP TRADING COMMENTS TODAY AS I HAVE SAID ENOUGH ABOUT THIS STOCK MARKET PROGNOSTICATOR

HUH?


From the you can't make this stuff up department, our guy Jim Cramer was on the Today show this morning and guess what he said. Well I am not exactly sure but I am going to quote Barry Ritholz from his excellent blog:

"I was towelling off my head, so I may have misheard this at 7am, but:
Did I hear Jim Cramer on the Today Show declaring this to be the start of a new Bull Market?
Mark today's date: 3/17/06.

I suggest we revisit this in 6 months, when I will either a) eat crow, or 2) Point out that JJC topticked a major reversal for the 2nd time in 6 years . . ."

I suggest that anyone who thinks that today is the beginning of a Bull Market look at the 3 year chart above of the SP 500. I think it started about 3 years and 500 points ago.

SHARK TO SHARK


Maybe revshark is reading The Shark Report or maybe he is just a real good trader (lol), but he is certaintly echoing my thoughts on trading the QQQQ from the long side. He likes a short in the DIA v the QQQQ long and my idea was short SPY. Regardless it still follows my idea of buying weakness and selling strength and for good measure fading Cramer.

Looking at the markets and the sectors today, the winners are the metals, homies and Small caps. The losers are the oils and the Volatility Sisters. The techs and the Semis have gone back to flat and the market internals are a hair green. I do not expect to find anything much different when the closing bell rings.

NOON TIME LOOK


The markets are basically no where today as option expiration proves to be another bust. The interesting action is in the homey sector as folks are thinking rates are going to go down. I am thinking of a long SMH/QQQQ position vs my SPY short as I have a suspicion that the shrewd guy on realmoney may have bottom ticked the NAZDAQ. Note that the SMH has turned from the red dye to slightly positive and the QQQQ has also turned to a bit higher on the day. The internals on the NAZ have also slowly improved today.

REVSHARK V CRAMER


It looks like Revshark caught a little of the same Cramer comment that I caught this morning and I agree 100% with Revshark. Cramer said:

"They can't all go up at once. And they never have. A bull market is a preponderance, not a big stampede that embraces all cattle.

I say, forget about the Nazz for awhile. It's the big listed guys' turn. That's enough to do the job, and for once, accept that stocks are really and truly breaking out. While Marvell and Broadcom were leaders, it's their time for a breather. No more than that. "

Revshark said and I quote:

"We have mixed breadth with the Dow leading. Banks and retailers are acting well again, but anyone who thinks we can have a bull market without the Nasdaq cooperating needs to do more analysis."

Just look at the charts and you will see the STOCKS do not go up without the NAZ.

10:00 UPDATE

The markets are flattish and the internals are following suit. The only spots standing out are the homies to the greenside and the techs to the redside. The 10 year rate is rising again up to 4.67% and I would watch that action carefully. The Volatility Sisters are lower and it looks like Jim Cramer on realmoney is throwing in the towel on another tech rally.

MORE ARMS


Our friend Dick Arms has some morning comments on realmoney and he seems to be hedging his opinions:

"But now we have seen a decisive move through the top of the consolidation by all the major averages. That suggests more of an advance is in the offing.

On the other hand, the short-term moving averages of the Arms Index have now become overbought enough to get our attention. The sudden buying spree in the market has pushed the Arms Index moving averages to levels that often are seen at or shortly before a short-term top. That suggests that the current advance may have progressed so rapidly as to get a little ahead of itself.

I still am willing to hold long positions and not fight the tape, but any sign of weakness would prompt me to take profits in short-term trades with the intention of coming back in on a pullback to the breakout level."

First, Dick is wrong, we have not seen a move higher by the NAZDAQ COMP or the NAZDAQ 100 and they are still major averages. Second, his ARMS Index is now at an area often seen at or shortly before a major top and that conincides with my major indicators.

Otherwise, I agree with him, any sign of weakness sell and then buy lower.

TECHNICALS SPY


The song remains the same with the SPY. The SPY has been making new highs but the momentum indicators, MACD ROC, have not. So the general rule is that the rally will run out of gas. History will tell you that the SPY should sell off here and I would not be buying this breakout. The general rule by the professional is that breakouts are to be sold, far different than what one may hear from a TV personality.

3.16.2006

ANOTHER INDICATOR


One of the first trading books I read, (at the end of the last century) was Dr. Alexander Elder's TRADING FOR A LIVING. This is a terrific book for those who want to learn about technical indicators and trade the markets. Dr Elder's overall methodology is fairly simple; identify the trend and buy or short pull backs or pull ups into the trend.

He also "developed " an indicator that I track daily called Elder-ray. This indicator identifies overbought and oversold markets by taking a moving average and applying something called BULL POWER and BEAR POWER to them. Bull power is calculated by subtracting the moving average from the high of the daily (or any other period) bar and bear power is computed by subtracting the moving average from the low of the bar. The general rule is that if Bull Power is negative and rising and the trend is up, it is a buying opportunity. If Bear power is positive and falling and the trend is down, it is a shorting opportunity.

I monitor bull and bear power on a daily basis using a 13 day SMA and I find that if they are both positive, the markets are generally overbought, and if they are negative, the markets are generally oversold.

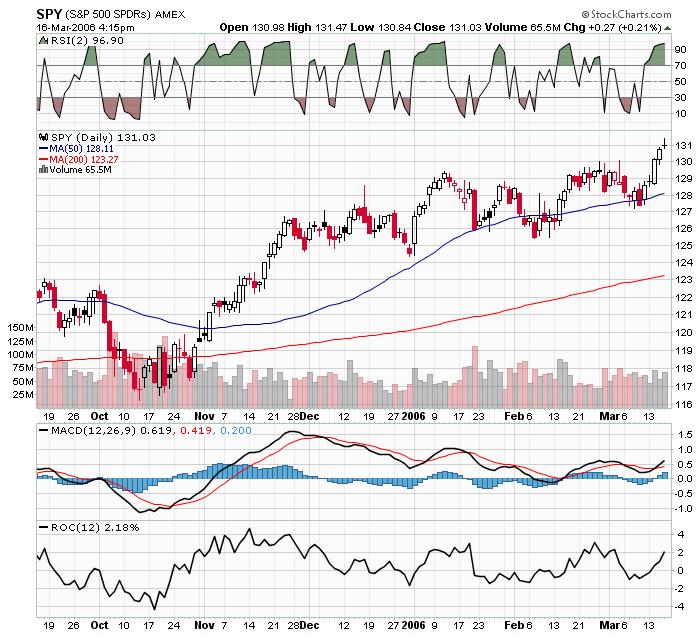
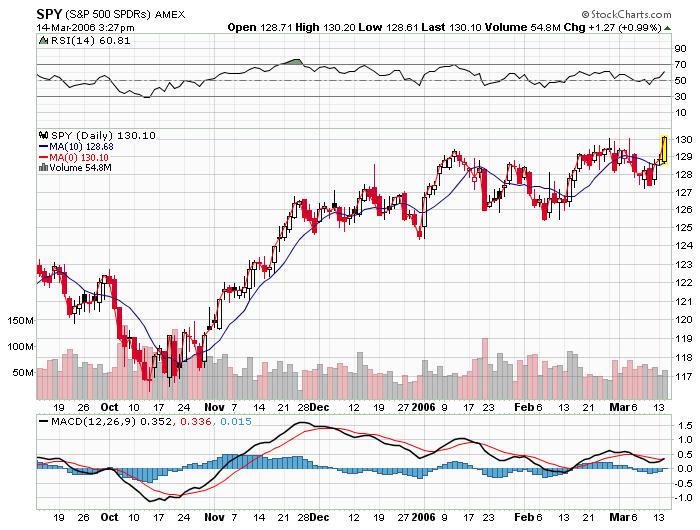
Today on the SPY, the BULL Power and the BEAR Power are as high as they have been (+2.5 bull and +1.85 bear) since January 11, 2006. If you check the charts you will find that was an excellent time to sell the SPY.

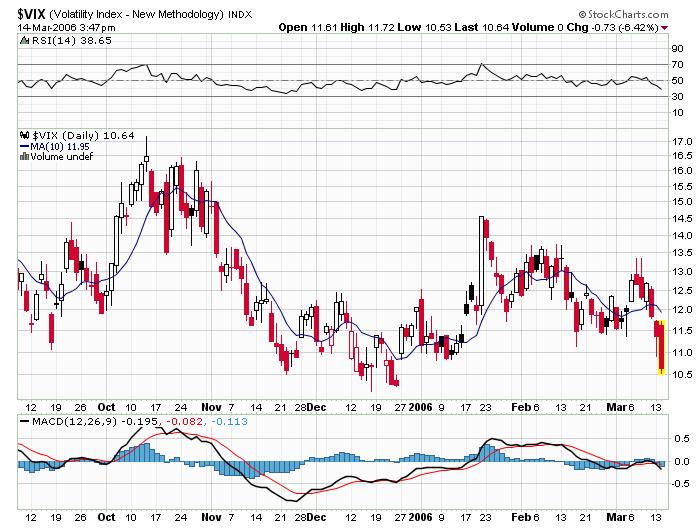
I use this indicator in conjunction with the Volatility Sisters, the 2 day RSI and a moving average of the advance/decline lines.

Presently the 2 day RSI on the SPY is 97, the highest it has been since January 10 and the internals are the most overbought they have been also since January 10.

Sounds like several indicators have aligned and the market is going to have trouble moving higher from these levels. Note the crummy action today on the NAZDAQ and the Semiconductors.

SHOW ME


Well contrary to every guru on TV, the market closed with a whimper and not a bang. The SPY ripped in the pre market on the inflation news and closed up 25 cents. The QQQQ closed down .8% and the big loser on the day was SMH red by 3.25%. The oils helped the SPY stay green as the OIH was green by 1.5%. Small caps, brokers and banks were flat and as mentioned earlier the GOGO names of the recent past all closed red including AAPL AMGN BRCM GOOG and GS. The NAZ internals were slightly pink and the NYSE internals were 1k to the green side in light of higher oils and lower bond yields. The Volatility Sisters were up on the day and that is encouraging for the bulls. I am still short the SPY and the trade is a hair to the red side as of the close. It would not surprise me to see the market sell off in the next few days as the NAZ and the SEMI's are usually leading indicators.

THEY ARE BACK


I was out for a few errands but now back and I see the markets are mixed but the Naz is taking a hit with the QQQQ down 1/2% and theSMH lower by about 2%. Most of the GO GO stocks are also lower led by GS BRCM AMGN AAPL and GOOG. This does not bode well for the overall market. The NAZ internals have turned flat and the NYSE are green by 950, and they are being skewed by higher fixed income and higher oil stocks. The 10 year interest rate is back down to 4.64%.


On another note, in addition to the giddy Mark Haines this morning, Jim Cramer on real money is now saying:

"What we are seeing is typical bull-market behavior, very different from what we saw even a month ago -- and I am cognizant, as you know, that some of this is expiration-related and blow-through-strike-related, when those strikes usually serve as lids.

There are two keys to noticing the difference between this market and the previous one we just morphed from. First, we were perpetually opening up, and you had to fade the opening or sell it. You had to do that because the money from the opening was from overseas and was quickly blown away by U.S. selling.


Now, you have a market that opens gently as bulls hope it will come in, and then the bulls capitulate and come in."


I do not want to rain on the parade, but following these guys has not been a great proposition. Cramer always seems to get excited at the highs and depressed at the lows. Remember the studies show, and they were done during a big bull market between 1989 and 2003, buying 5 and 10 day highs is not the way to make money. Keep your powder dry and wait for pullbacks as will be signaled by an overbought VIX and oversold SPY.


THE ULTIMATE INDICATOR

Mark Haines, he may just be the ultimate indicator. He just mentioned how great the market looks, volume looks good, market internals look great everything is grand. He is more giddy than Bob Pisani at his happiest. Now the bad news, the internals are back to 900 net green, the semis continue to underperform down over 1%, the QQQQ has turned red as have Small caps, GS is down a beaner and a half and the SPY as I type is up a whole 12 cents. I have reshorted my position from yesterday and I will be watching very closely as the GAP closes. I will be keeping that 130.5 number on my radar.

EARLY LOOK

The flickering ticks are mighty interesting this morning with the internals 1,800 to the green and the Banks/Brokers solidly green along with the homies and the Small Caps. The Semis, AAPL AMGN, the metals and the VIX are solidly red. Initial Resistance on the SPY today is 131.13 and Second Resistance is 131.5. No sign of Gap fillage yet but the day is only 1/2 hour old.

GAPS AND PIVOTS


In the for what its worth category, the daily Pivot Point discussed in a prior post, is generally touched or traded through appoximately 75% of the time in liquid markets such as Index ETF's.


How is that helpful to trading? A market that trades above its Pivot Point is generally bullish and those that trade below their Pivot Points are generally bearish. So one may have entry plays into pullbacks and pullups into the general trend as it approaches the Pivot. Also, if a market rips above its Pivot Point or plummets through, it may be setting up for a change of direction trade.

Todays Pivot Point on the SPY is about 130.5 and the pivot point has not been touched on the SPY since early tuesday morning. That could be an important level to watch if the markets fill the opening gap.

TECHNICALS OIH


The oil service holders ETF is filled with large cap companies such as SLB HAL and RIG. If one looks at the chart, it is apparent that it has recently run into overhead resistance at it 50 day SMA which is now about 142 and change. It is currently trading a tad under the 50 day but any push higher may be shortable or if owned it may be a good time to sell calls.

REFRESHER

Just a little refresher, in my post the other day I mentioned the facts behind buying weakness and selling strength. During the 15 years of the statistics mentioned, the SP500 showed a gain of zero after a one week period after making new 10 day highs. I did not see any information on new 5 year highs, but I will guess that the same statistics will apply. Anyhow, that is the basis for my shory SPY call yesterday.

3.15.2006

MORE FUN FACTS

Did you know that the % increase/decrease year to date for various securities/indexes is as follows:

SPY 4.9%
QQQQ 3.1%
IWM 10.8%
HHH -12.7%
SMH .16%
GOOG -16.8%
AAPL -7.9%
OIH 8.97%
DIA 5%
SSRI 22.8% (STANDARD SILVER RESOURCES)
INTC -20%
DRG 4.2%
MSH 3.77%
NAZ COMP 4.8%
NAZ 100 3%
MSFT 4.55%
GLD 6.7%
IBB 8.65%

I find it plenty interesting.

ONE FINAL THOUGHT

I just love that picture. My last comment of the day is that the 2 day RSI for:


SPY=96

QQQQ = 96

IWM=95

DJIA= 98

Ok that is it.

I AM OUT

I am out of my short trade. Yes that is/was Jim Rome's mantra when his show was over. Where is he now anyway? Never got the whoosh down but that is ok as I have covered 1/2 the position. Note how the SPY hit its head again at daily Resistance(130.74) and struggled. I will probably put the trade back on in the morning as my transaction costs are minimal through TRADESTATION.

No time to make fun of Cramer as I was trading most of the afternoon. I noted my short SPY trade and I confess I do not like shorting stocks. For whatever reason, most traders/HF managers will tell you that making money on the short side is difficult. I like to have all the indicators line up for my shorts and I do not let them get away; they either work quickly or I am gone. If they work, I generally cover quickly and move to cash. I have no problem sitting in cash waiting for the market to provide long side opportunity.

The close found the market up 6 on the SP500, 16 on the NAZ and the internals were 1,650 to the green. The only things of interest that I see struggling are AAPL and GOOG. The metals were especially strong and the trannies I keep hearing made all time highs with the Russell 2k. One final word, the CNBC folks including Ratigan, MCC and Pisani all sound positively giddy and excited about the highest markets since spring of 2001. (WARNING WARNING)

SHORT TIME


The SPY has just busted out (broken out) to the 130.65 area and I have just sold it short. This is a day trade as I expect some selling to come even in light of the upside jig in the internals to 1,200 green. Most sectors have also flipped green sans the Oils. Note also the drippage in the VXN asi t now is more than 11% below its 10 day SMA. My SPY trade is a day trade for and I will not let it go past 131. I intend to cover it on a blip/whoosh down.

BOO!!!


My buddy Todd Harrison on the excellent financial infotainment site Minyanville.com, yesterday slipped two of his appendages into his metaphorical bear costume indicating that he has 50% conviction of the bearish side of the market. Toddo was the President of Cramer and Berkowitz (Jim Cramers old hedge fund) and is the founder of Minyanville and was the predecessor to Rev Shark at the real money site. He has made some excellent calls in the past and although I am not short the market at this point (no SPY position) , I believe he is correct with his short term bearish call.

1:00 UPDATE


The markets are still mixed here but the internals are starting to turn a little more bullish with about 300 more gainers than losers. The SOX, Internets, Brokers, Banks and Metals are mixed, OILs are lower, GOOG and AAPL are trashed, and the 10 year is hanging at 4.75%, up over 1% on the day.

The VIX is very perplexing as it is now almost 7% higher as the market has flatlined. The VXO and VXN are about 2.5% lower.

I have not made a trade today as I have no edge. The SPY has just hung out without much movement between its Pivot Point and First Resistance.

THE OTHER SHARK


Revshark on realmoney is also getting nervous about the markets as he now says:

"I don't mind telling you that I'm fairly skittish about the market after the pounding many of my stocks took last week. I recouped most of it the past couple days but am still a tad off my highs. I don't want to be slapped like that again so I'm tightening up my defense and I am not hesitant to hit the sell button."

I usually like Revshark's market feel, but I never quite understand how he is usually at his "highs". Maybe its only me whose not usually at account highs.

Adam Warner on the Daily Option Report also has an excellent piece today on a debate between two market mavens.


BACK AT THE RANCH

No, I am not doing a "mon back" on XRAY, but I was at the dentist having my teeth inspected. My return here at 11:30 EST shows the markets flat with OILs and SEMIs red, GOOG crushed, the ten year back at 4.75%, brokers lower, homies lower, market internals flat after being higher and the VIX ticking back up 5%.

Also, todays Pivot Point on the SPY is around 129.65 and that may be a point to get long for a quick daytrade. Resistance is up at 130.75 and I doubt we get there.

BIGGEST ARMS


Dick Arms of ARMS INDEX fame and a realmoney contributor has an interesting take on the markets today:

"In the last few days, the averages have indeed moved higher, but not dramatically. They are all, even the S&P 500, which had shown good strength earlier, butting up against the old highs and acting reluctant to get going.

What bothers me most is the fact that we have had bullish Arms Index numbers in the interim and they have been offsetting more bearish numbers on the shorter-term moving averages. Now the 10-day Arms Index moving average has gone to a level that could no longer be called oversold and is, in fact, somewhat overbought. The same can be said of the five-day. At this point, we may lack the underlying impetus needed to bring about a good advance.

Because the averages are still moving upward and the AI numbers are not at an extreme, I still suggest continuing to hold long positions, but I am becoming concerned about the shift in the AI."

Dick notes that he is concerned about holding long positons and I think it is time to abandon longs. Not sure if this is the high but I would rather sell too soon than too late. Besides, all of my short term indicators have aligned.

Pre Market Random Links

The story of Fatigue in the White House!!!

Dr. Brett finds some Interesting Trends!!!

An Interesting article on the use of Pivot Points!!!

S and P thinks the Markets are hitting the Ceiling again!!!

Has the Curse of the Bambino Returned?

A Day in the Life of Bill Gross!!!

The End of a Very Long run!!

Welcome to Howard's World!!!

Real Bracketology!!!

Now I know Why Couples Fight!!!

3.14.2006

THE PICTURE AND THE 1K WORDS


There you have it, I guess I need not say a whole lot as the VIX has crashed and the SPY has soared. A picture is worth one thousand words in this case. Buyer beware as every time the VIX gets to these levels, the SPY goes back down. In addition mucho resistance up above the 130 level.

TWO QUOTES

Here are two quotes to remember:

Someone will buy at the bottom and sell at the top, however, I can guarentee it will not be you.

The only ones who buy at the bottom and sell at the top are liars.

I can assure you both quotes are accurate.

One of the complaints of most traders is "I sold to early," well I can also assure you that selling too early is far better than selling too late.

The markets are generally overbought and the Volatility Indexes are all oversold. That is not the way rallies start and I reccommend to those who are thinking about buying or not making some sales to go back and read these facts.

RED VIX ALERT

The VIX is now down 7% to 10.59 or about 11.5% below its 10 day SMA. It generally does not get more oversold than this although there have been times (not many) when it has gotten to 15% below. I would not count on 15% below so if you are buying please make sure to use tight stops. The 2 day RSI on the SPY is now up to 93- so the indicators are aligned.

1:30 UPDATE

The image that should be there is one of Miles Davis but for what ever reason the "blog image uploader" is not working properly. The reasons for a Miles picture are 1) his induction into the hall of fame and 2) tooting the horn of following those Pivot Points as the SPY just shot through Second Resistance after hanging around right under them since 11:30 EST. The SPY came down to the 128.9 area which was a nice buying opportunity set up for a quick day trade especially in light of the improving internals and the dropping bond yields. The bad news is that the Volatility Sisters have sunk to session lows and are within a hair of giving sell signals at 10% under their respective 10 day SMA's. The SPY is also at a 2 day RSI of over 90 so another sell signal is lining up. I do not say that the market can't go higher, it can, but the odds are slowly leaving the bull. I think better buying opportunities will appear in the future as the overhead resistance gets thicker as we get to SPY 130 and the VIX et al sinks to levels the markets rarely rally from. Its the old buy lower sell higher mantra.

12 UPDATE

I was hoping to hear from the Murry twins on CNBC this morning but not a word. The markets have found a bid this morning on the heels of the falling interest rates. The 10 year is back down to 4.7% even and that is giving a jig to just about all sectors and especially to the homies which are now higher by almost 3%. The Small Caps have also flipped the upside switch with the internals which are now 1,400 to the green. Big Cap tech and the SMH also doing well for the bulls. The VIX surprisingly is only down by 2% so its not like complacency rules. The SPY is trading right up to its daily Second Resistance point at 129.5 and that may be a good place to sell em if you got em.

FOR WHAT ITS WORTH

In light of yesterdays discussion on Pivot Points, the SPY this am ripped right through the daily pivot at 128.85 and is now sitting at initial resistance of 129.15. The second area of resistance is 129.5 so these points may come into play later today with the Pivot acting as support. Also, note how crummy these internals are, the Naz are pinkish and the NYSE is slightly green. A fairly confusing market in my opinion.

TALL GREEN BARS


Watching the markets this morning I see tall green bars and high ticks. Why? My guess is the falling rate on the ten year bond and the home run earnings from Goldman Sachs. As I type, the rate is down to 4.72% and the homebuilder sector is green by over 1%. The screens are showing green all around and red on the Volatility Sisters. The internals are about 250 to the upside which is disappointing but they started at about 800 to the red so they are in recovery phase. One fly in the ointment is the underperformance in Small Caps which are flat to pink. The leadership for now looks like it is coming from the BIG CAP tech as the QQQQ and SMH are up almost 1%.

HELENE

Helene Meisler over at realmoney is writing this morning about the NAZDAQ and its impending problems with the 50 day SMA. She suspects that the 50 day line will soon be resistance on the Index and she makes the following observations:

"An upward-sloping moving average line is much easier to overcome than a downward-sloping one. The Nasdaq broke its 50-day moving average for the first time back in early February, but it wasn't meaningful since it was still heading upwards (the moving average line was still heading upwards). It broke it again last week and has yet to recapture it. It is still heading upwards now, but as I just described, within five trading days it will not be heading upwards anymore and will act as overhead resistance.

The DJIA does not have the same issue, since the DJIA only went to higher highs recently. The S&P is pretty much still in the same area as it was in early January, and is currently trading above (just barely) its 50-day moving average. And the Russell is still trading well above its early January levels, so here again this is not an issue.

This doesn't mean they aren't also vulnerable, but their patterns are clearly different than the Nasdaq's at present.

We still have time to get that whoosh that cleans out the sellers and gives us a better rally, but so far we've not been able to muster a selloff that makes this current oversold rally anything more than a lethargic move to relieve the oversold condition."

I think anyone who has been paying attention to the NAZDOG recently can attest to the fact that this index just can't get anything going. Everytime it rallies, it immediatly sells off. I also note the crummy action in the SMH. This action does not bode well for the overall markets.

3.13.2006

POST CLOSE PRE OPEN RANDOM LINKS

George W. Bush Imitated

Remembering The Tech Wreck!!!

YHOO GOOG GOOG YHOO

Anti Aging and the Promise of Youth

GOOG and their GAFFES

Ken Fisher on KFY and TIF

Gartner sees lower PC Growth for 06.

Homes Boats and Cars of the Billionaires!!!

George Will discusses Baroid Bonds!!!

Should NOT SO Super Mario be Dumped?

MCDEP Likes AP BP and OXY

MARCH MADNESS

Boucher on What Bonds may be Telling!!!


Where is Elaine

now?

Avoiding the IRS Tax Examination!!!


Coming to America?

ALL ABOUT THE CLOSE


There we have it, the major market indexes are unchanged give or take a few points. The Sox and Brokers were slightly pink, the OIL and Metal sectors were green and the Cow did have the disease impacting WEN and MCD. For those wanting more information, it was a cow in Alabama that had not yet reached the food chain.

The market internals closed with about 550 more upsiders and most of the stocks on my screens are lightly pink. Also, note the VIX is down about 3.5%, so no buy or sell signals today. The SPY also closes to the upside at 128.85 right where it opened and a 2 day RSI of about 80. The Bottom line is that it was a dissapointing day for the bulls in light of all the merger activity.

STOP TRADING TIME


It is time to stop trading and listen to Cramer tell us what we should be watching. I can tell you that Merger Monday has been a big dissapointment to the street as the DJIA is red and the other major market indexes are mixed. The only sectors with any juice today are the oils and the metals. The internals, which started the day with 2,400 more upsiders has dripped to only 500 green. Very unimpressive. The SPY which I anticipated would get back over 129 only made it to 128.96. There is significant resistance overhead and I think the markets are better to sell than to buy. FWIW, Jimmy is perplexed that the market can't move higher in light of all the Merger Madness. May I suggest to Jimmy that he do a little technical analysis to find that we are right under significant resistance and rates are rising. Seems to me for now when markets go up they get sold and when they go down they get bought. Hmmmmm.

UPDATE 2:00

Markets are sitting at about the same place they were earlier this morning. The Semis continue to act doggy compared to other sectors and that does not bode well. The internals are now at 1,160 net gainers and I am none too impressed with this reaction to MERGER MANIA MONDAY.

The best performing sectors have also flipped to some old favorites the OILs and the METALS. It will be interesting to see if the SPY gets rejected again in the area just north of 129. It would not surprise me.

PIVOTAL POINTS

Montauk Point, what a terrific place. This morning the SPY hit its daily resistance at 129.15 and immediately reversed lower. It is pretty interesting to watch the action in the SPY as it moves to its daily pivot point, support and resistance levels.

The calculations for these points are fairly simple. The daily Pivot Point is the average of the prior day high, low and close.

The formulas for the daily Support and Resistance levels are a bit more complex and they are as follows:

The First Resistance Level is R1 = (Twice the Pivot Point) less prior day's low.

The Second Resistance Level is R2 = (Pivot Point plus prior day's high) less prior day's low.

The First Support Level is S1 = (Twice the Pivot Point) less prior day's high.

The Second Support Level is S2 = (Pivot Point less prior day's high) plus prior day's low.

Most major real time charting software have these "points" built in to the programs and I always keep all the lines clearly visible on the charts. It is quite interesting to watch (and maybe profit from) the action around the Pivot Points and the Support and Resistance levels. One note of caution, sometimes there are bad ticks and these at times will cause incorrect caluculations.

GAP FILLED OF COURSE


So with all the March Merger Monday Mania, the major market indexes are slightly green to mixed and of course most of the GAP opening has been filled. The semis are pink, and the recent momentum darling stocks like BRCM MRVL and GS are all lower. The internals are now just 1,300 to the positive down from 2,400 at the open and the VIX is still down by 4.5%, so it looks like the market is going to have problems moving higher from these levels.

MARCINATED


Marcinated is a term that was coined by Adam Warner at his terrific blog The Daily Option Report. Bob Marcin is a PM and a commentator at realmoney who has been plenty arrogant in his bullishness for homebuilders and bearishness for crude. He has also been very bullish on MOT and has even been quoted in Barrons about it. Of course I haven't heard him mention it much lately. Whew, that is one ugly chart.

30 MINUTES LATER

The market is hanging in on the outside but inside I see the internals falling back and the real fly in the ointment are the semiconductor stocks. These semis just can't get anything going and if they don't get any jig the NAZDOG will not be able to make any progress either. One other thing, the jig in the oils today. Can't remember the last time I saw the OIH up over 3 beaners.

FIRST LOOK

The markets open green with the internals showing 2400 more stocks up than down. Banks Brokers Semis Oils all green and metals are mixed. The index leading the way- do not tell the talking heads on TV but of course that is correct the Small Caps IWM + 1%. The SPY is up to 129 and change and the 2 day RSI is back up over 80 while the VIX is plunging almost 5%. There is lots of resistance between this point and 130/131 on the SPY and I am selling more stuff into the ramp including my lucky AZR stock. What a dog that has been but most dogs do get their day (lol).

RANDOM OBSERVATION


When I awoke this morning, I noted the SP futures were positive by about 4 points. I also saw that it was merger Monday as Watson Pharm (WPI) was buying Andrx(ADRX), McClatchy(MNI) buying Knight Ridder(KRI), Capital One (COF) buying Northfork (NFK) and Pinnacle(PNK) for Aztar(AZR).

Everyone loves mergers as it gives confirmation that stocks are priced fairly or they may even be inexpensive. Also, note that the futures are now barely green. It just doesn't give me a warm fuzzy feeling that stocks are going straight up from here.

3.12.2006

TECHNICALS IWM

A few traders have asked if I have an opinion on the Russell Small Cap Index (IWM). My take is, like the general market, the IWM is more of a sell than a buy. The index was making new highs until about ten days ago when it started turning down. It has now bounced from that oversold condition and is probably a short here or a little higher. The key momentum indicators have not gone up to the new highs with the index indicating the momentum forces are receding and the index will probably turn lower.