9.22.2006

ONE MORE TIME


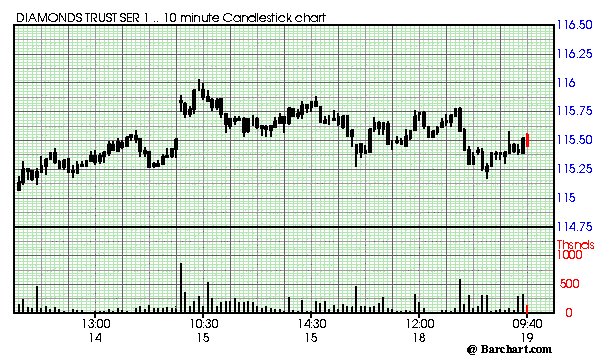
The Tick Fade Trade hit again at around 3:20 est when the ticks went over 1,200 and drove the DJIA Futures contract to 11597; DJIA subsequently backed off along with the ticks to a low of 11571 on the 3:50 bar; 26 points in 20 minutes.

So, if one traded 5 contracts and got 20 of the 27 points that is a quick $500. To day trade 5 contracts on YM, one needs about a $10,000 futures account.

Not bad, and this is one trade that sets up four or five times a day and is quick and reliable if its traded with the trend or in choppy markets.

It is however a trade where one can't be greedy and has to act quickly.

AFTERNOON TRADE


Market internals have done a pretty good job of "telling" that rallies were going to fail today. Of course the day is not over.

The Tick fade trade has been my trade of the day as the afternoon has given a few "short the tick exuberance" trades. I try to get 10/15 DJIA futures points with a tight stop of 15. It works pretty well but has to be done with good size to be meaningful.

One take on the day is that interest rates are lower (10 year Bond 4.6%) and oil is down to the $60.55 level, and the markets can't muster a rally. If this were 10 days ago, the DJIA would be +150 and the NAZ +40 but that was then and this is now and the Philly Fed from yesterday may have knocked some of the bigger slow down sense into folks.

NOON LOOK


Markets continue to trade lower with the only green on my screens being metals, KLAC and GS. Market internals are telling a bearish story with with about 2,800 more losers than winners.

The volatility sisters of VXO/VIX are making a slow climb back to the favored bar mitzva level of 13, but hardly a sniff of fear.

Small caps and tech not including semis are taking it on the chin as the QQQQ has now dropped to the 39.75 level or about a dollar off its high from yesterday. AAPL AMGN and biotechs are helping the QQQQ lower and those stocks may just drag the rest of the markets lower with them. Brokers a little brighter sign as GS keeps the green and I guess that buyback announcement is giving it some jig in spite of the broader sell off.

Interesting how in just a few short hours of trading yesterday and today, the major indexes are back to where they were ten days ago on September 12.

My game plan is to look to short the pullups here as there are very few signs of a bullish turnaround.

THE OPEN


Markets open lower and one thing I bet you won't here from the Pisani/Haines group on bubblevision- Hey Bob is this a double top on the DJIA as we get up to the May highs on the Dow and sell off again"? Could be an ominous sign but you won't hear it from those "journalists."

Another thing on my screen quite I find bothersome, the rate on the 10 year Bond is down to 4.61% as stocks are lower. That is worrisome as bonds may be signaling a deeper slowdown and stocks may finally be agreeing. The good news for the bulls, the action in the semis as they are about the only green on the screen- possible snap back rally- perhaps.

Worst sector performers include small caps, tech, biotechs, airlines and retails. Best are metals and the aforementioned semis.

Volatility indexes are "ramping" to the 12/12.5 level. Not a lot of fear, and who would have thought that the QQQQ would ever go below 40 again?

TECHNICALS-SPX


Markets are set to open lower but the gap fade trade may be in play. The trade is to buy the gap and use a stop equal to the size of the gap. According to John Carter, Friday's have a tendency to fill the gap 78% of the time over the 4.5 years that was tested for his excellent book Mastering The Trade.

Back to the chart at hand, I asked several folks yesterday if they thought this was the beginning of a new downtrend or just a blip in the uptrend. The answer was the same from everyone, no idea.

Those momentum indicators, especially the Rate of Change indicator is telling that the uptrend is running out of momentum. One of the first books I ever read on trading was by Gerald Appel, where he described market buyers with lots of power in the beginning of a run and then fading as the buying power dries up. Like a golf ball being hit off a tee and being brought back to earth after it runs out of power.

Anyhow, that seems to be what is happening now as all those momentum indicators are flashing bearish divergences. Also check the action on the Smelly Sox, generally a leading sector of market direction.

And speaking of golf balls, check out the Ryder Cup today (TNT), one of the best events in sports as there is always passion, excitement and camaraderie.

9.21.2006

ROLLOVER?

So did the Philly index give market participants a dose of reality? Were the smelly SOX telling us something over the last few days? And why buy stocks (except very short term) when the VIX/VXO levels are around 11/12?

And isn't it great that the 10 year Bond is back down to the 4.65% level, a full 60 basis points under the 5.25% Fed Funds rate.

So who is correct, Stock Buyers who have driven the DJIA to about 100 points below the all time highs or Bond traders who continually tell us the economy is slowing?

And who would have thought that oil stocks would ever have a green day again?

Green sectors today include GOOG AMGN oils and metals with just about everything else in the red with semis, internets, small caps, airlines and retailers bringing up the rear.

Market internals aren't wildly bearish at -1,500 but the DJIA is getting crushed on the heels of the HPQ news while the SPX is buoyed a bit by the crude patch.

NOON LOOK


The Philly Fed has come in and knocked the markets down with some market unfriendly news about business conditions. Markets were trading slightly higher before the release with the DJIA a bit weaker on the heels of the constant negative newsflow on HPQ.

Market internals have flip flopped between green and red all morning but seemed to have been firmly green (+1,200) before the Philly release. My guess is the dippers will look at this opportunity as a gift. Why would business conditions interfere with a steady uptrending stock market?

Sectors acting best today include oils, GOOG AMGN metals, GS and internets; losers include semis, consumers, cyclicals, retailers and airlines.

One of the indicators that I watch all day is the TICK, it seems that when the internals are green and the TICK stays in the box between zero and +1,000, odds are pretty good that a bullish strategy of buying dips and selling rips will do well. Also, check the pivot points for areas of support and resistance and honor your stop and one can make a pretty good trading system.

SHOCKING NEWS

Contrary to every other day in what seems forever, the markets are lower and perhaps there will even be another day when the markets close lower.

Weighing on the markets seems to be the fact that oil prices are not plunging but are up a few pennies. Oil stocks are generally higher with OIH and XLE both +1%.

Sector leaders besides oil includes, GOOG AMGN GS EBAY internets and metals. Leading lower are semis, trannies, airlines, cyclicals, consumers and small caps.

Market internals are slightly bearish with about 900 more issues lower than higher.

Volatility indexes are barely off the floor as the VIX/VXO tandem trade between 10.5 and 12.

The DJIA front finds MCD BA XOM higher with HPQ GM IBM and WMT lower; 13 up 17 down.

No clue as to direction but a selloff after the recent run should not surprise anyone.

9.20.2006

SMELLY SOCKS

If the markets are/were rotating to tech why are the SOX/SEMIS not making higher highs with the NAZ/SPX? Just some food for thought as that 200 day SMA looms overhead.

FED DAY


If you like to trade without discipline, days like this are for you as just about all reasonable prices on the major market indexes are hit. Of course if you trade with discipline, all stops are also hit so probably the reason why many smart traders refuse to trade it.

The oil patch continues to be a house of pain as the oil proxy, OIH is down close to $5 as I type. Of course it won't be too long in my humble opinion before we will here that buying these prices was "the smart trade." Not sure when but it will happen.

Big winners on the day include GS, AMGN, brokers, airlines, small caps, financials and retailers. Losers include oils, GOOG and metals.

Market internals bullish with 1,900 more winners than losers but were way better this morning when winners trounced loser by well over 3,000.

The VIX/VXO combo are trading down 4% at the eleven level and the markets have had a lot of trouble making headway from those levels in the past, so I anticipate a lot of churn for the balance of the week.

And who feels badly that they aren't at Boston College participating in the Mad Money games with Jim Cramer. Man wish I were there.

TECHNICALS-VXO


Again, a chart of the VXO kind of tells one that this is not a great place to buy stocks as markets stalled and turned lower several times in the past at these volatility levels.

Markets are sitting at multi year highs with a bit of a stall here at daily pivot resistance of 1327 on SPX and 11,610 on the DJIA. Hardly a mention on bubblevision of the outperformance today of the small caps as IWM is up 1.4% while SPX and DJIA are both higher by .55%.

Keep an eye on the semis as they seem to be the first to turn and right now they aren't looking so bullish up 30 cents and considerably under last weeks highs. The TICK, also a pretty good clue of market direction, spent most of their time +500 earlier, now mostly at the flat line.

Also note the crummy action by the internet stocks on the heels of yesterday's YHOO warning, GOOG is red and EBAY/YHOO are unchanged.

Market internals still very bullish at +2,500.

And is this Dylan Ratigan/Fast Money commercial one of the most annoying commercials seen in a long time.

THE OPEN


The markets are ripping higher out of the gate as tech, trannies, brokers and metals lead while lagging are internets and oils. I also don't see any great enthusiasm for semiconductors as the SMH is up thirty cents and way below the recent highs over $35.

Market internals are very strong with 1,500 more winners than losers on NYSE and 1,200 more winners than losers on the NAZ.

And what is with CNBC, Pisani, the great contrarian indicator come out and says folks are selling oils and buying techs, well on my screens OIH is green and the SMH is up 25 cents; then Ratigan comes on TV and says metals are selling off while on the bug above and on my screens, Gold is up on the day.

The question I have is why do we watch these guys and how often are there teleprompters updated. I guess we all watch because we feel we will miss something if we don't. Watching has never made me any money and their teleprompters are obviously on some kind of delay.

ARMED ADVICE


Interesting time as the SPX is about to challenge its May 8 high of 1326 on the morning of a Fed meeting headed by Big Ben who just a few short months ago was deemed untrustworthy by the markets.

In case you haven't heard, or can't see it, the SPX is about to challenge the old May highs while the momentum indicators scream SELL with their continuing bout with lower highs. Of course the momentum indicators were not in on the secret that crude was about to test a 5 handle, so maybe they are not all knowing. And who would have thought $60 crude would bring about robust economic activity?

One other note besides whose more scared the bulls or the bears; how about how desperate are shorts who want to cover and how anxious are bulls to buy pullbacks?

For what it is worth, the VIX is back to the same level it was at when the market made its prior high back in May (12) and buying and holding at this VIX level is usually not that rewarding.

The dip that was bought big yesterday as noted by Dr. Brett may in fact be a precursor to higher prices, but the risk and reward seems to be in favor of the sellers.

Anyhow, Dick Arms of realmoney.com also has some thoughts on buying the DJIA at these levels:

"A believable breakout will need to have heavy volume and a wide trading range. That isn't what we have been seeing recently.

Meanwhile, the moving averages for the Arms Index remain quite neutral. The 10-day is at 1.07 and the five-day is at the same level, so we're not learning much from them. But there are other negatives.

The VIX is back to an area that usually coincides with a market high. The cycles also suggest a high in this vicinity. The low volume reflects a lack of exuberance. I continue to feel that the risks are high in this area, and I'm willing to remain cautious. "

9.19.2006

OUT

I guess that is why someone invented the STOP LOSS, as the DJIA futures trade goes awry with a large rally in the final 45 minutes. DJIA closes down 14, NAZ -13, and SPX -3.

The SMH bounced off its afternoon low of regained half its losses into the close. The QQQQ, a similar pattern as it also regains half its losses into the close.

GS C MER MSFT retailers, consumers and banks all green with the internets, oils, techs and biotechs the big losers on the day. Not sure why the markets think this YHOO news is company or sector specific; I doubt it but time will tell as more warnings are certain to come over the next several days.

Interesting that the VIX/VXO tandem rose a bit while the NAZ group, VXN/QQV both fell on the day.

Market internals improved in the last hour as only a total of 1,200 more losers than winners at the close.

AFTERNOON TRADE


The markets hit their lows around 12:30 eastern on the heels of the news out of YHOO and Thailand and have been bouncing around ever since.

Market internals still bearish with more than 1,000 losers than winners on both NYSE and NAZ.

Brokers and banks are still red but GS is trying to rally. Techs have pretty much sat at/near the lows since the YHOO news and IWM is trying to pop since the lows, so lots of crosscurrents.

Hoping the old adage of "markets that are down most of the day tend to close at/near their lows kicks in as I am short DOW Futures and anticipate the markets will close near the lows. And guess who is on the cover of Sports Illustrated.

BIGGER SELLOFF

Markets selling down hard on news of tanks rolling into Bankok and words out of YHOO CFO that the company expects to deliver at the low end of the range for the third quarter. Is it warning season yet?

That news is dragging the NAZ -23 and big dog GOOG -20 along with it. Market internals are now strongly bearish with each exchange showing in excess of 1,000 losers over winners.

The brokers were being buoyed by GS earlier but they have now turned tail on the heels of the tanks and the YHOO warning.

President W is about to speak and the market usually falls when he does so just a heads up.

Checking the sectors, reits are still green while just about all the rest are red with the worst being internets, metals, semis, trannies, biotechs and techs.


So is this a preview of more warnings to come? And how come Adam is becoming the King of YOUTUBE and I can't get a photo to load?

THE OPEN


After good inflation numbers and higher futures markets, the indexes have opened a bit lower with the biggest sector loser being the semis. Technology, drugs, metals, small caps all lower while sectors higher include retailers, oils and airlines.

The major brokerage houses are all trading in the red this morning and the BKX index is also slightly lower.

SMH, discussed in the prior post, has run into some real resistance at the $35 level and I would watch that sector for general market direction as lately its been the first up and the first down.

Market internals are slightly bearish with 900 more losers than winners.

It is setting up as a very uninteresting day and shorting high ticks on DJIA futures will probably be my main area of focus.

TECHNICALS-SMH


One of the strongest sectors during the recent market rally has been the SMH, which is an ETF that invests in semiconductor stocks.

Over the past few days, however, SMH has found a brick wall at the $35 level. I note also that the ROC indicator, a momentum clue, shows a bearish divergence as higher prices on SMH are greeted by lower ROC readings. Obviously the MACD Histogram is showing the same pattern although it topped several days ago. Stochastics also showing the same property as it has ticked down on higher prices.

Notice that back in July the same properties were present but in reverse as lower prices brought higher momentum readings.

9.18.2006

THE CLOSE

Markets close not far from where they started as the DJIA -6, NAZ plus zero, SPX +1.5 on the heels of higher oil stocks.

The hated oil stocks were the big winners on the day as the OIH/ XLE ramped on the heels of slightly higher crude.

Other sector winners included Indian stocks, Israeli stocks, metals, semis, tech and trannies. Losers included internets with YHOO and EBAY taking the biggest beating. Financials including most of the big brokers were also lower.

Market internals closed with about 180 more stocks lower than higher.

Volatility indexes, generally a mixed bag with most trading in the middle of their recent ranges leaving the buy low sell high group out of the markets as most ETF's are overbought.

I spent the day shorting the YM (DJIA Futures) on overbought Tick readings. It is a great system and anyone who wants to trade it should check out the John Carter book Mastering The Trade.

I suspect most of the recent rally came on the heels of lower interest rates (long bond at 4.75%, and lower oil prices ($78 to $62). I just wonder if we are now seeing the lows on both.

AFTERNOON LOOK


Markets have sold off a bit in the early afternoon trade and many are attributing the action to a revisit of Friday's high (major resistance).

The SMH, which revisited the Friday high of $35 plus has backed off again as has the NAZ. The rule is generally that as the resistance area gets tested the more chance of a break through it.

Market internals have flipped back to flat with sector leaders being oils, metals, semis (positive but way off their highs) and trannies. Losing sectors include internets, retailers, biotechs and consumers.

The 10 year Bond is back over 4.81% and one of the characteristics of this market rally has been the drop in the 10 year to 4.75%. So if it backs up, it may be the catalyst for an equity sell off.

The list of DJIA winners has whittled down to twelve led by XOM, CAT, AA, C and HPQ.

Volatility indexes are about flat on the day but keep in mind that regardless of what you hear on bubblevision, the markets are very overbought with the 2 day RSI on QQQQ SPX DJIA etc all near the 97/98 mark.

NOON LOOK

Markets continue to throw a mixed bag at traders as oils, metals and semis lead while internets brokers and retailers trail. EBAY YHOO HHH and AAPL all lower so its interesting as semis are up and internets are down.

On the DJIA, internals are 50/50, while in the broader market, internals are slightly green with 600 more winners than losers.

Best performing DJIA stocks today include XOM CAT HPQ INTC and JNJ while the worst are HD T UTX JPM and DIS.

Besides the hedge fund problems in Greenwich, CT, the charts of the day (on my screen) are the SMH, which is back to $35 again and whose components refuse to pull back; and the resilience of the OIH +$3 on the heels of mixed crude. Can the folks talking about crude be more bearish? Kind of reminds me of the call by Liz Ann Sonders a few months back.

THE OPEN


Markets open mixed with the DJIA lower by 11 and NAZ and SPX about break even.

Market internals are leaning a bit bearish with about 300 more losers than winners.

Sector leaders include semis, oils and metals with losers being retailers, financials and small caps.

The OIH is working its way back to the $130 level and the SMH is again trying to get back to the $35 level, so I would keep eyes peeled on those two charts for now.

9.17.2006

IMPORTANT JUNCTURE?


Important times for the NAZ as the index and the SMH are sitting right at the 200 day SMA. The SMH reversed early Friday morning after hitting its highs shortly after 10:00 eastern time. Note the bearish divergence on the SMH as price is higher but stochastics are now making lower highs. Yes, we have seen this picture recently but just another heads up.

The NAZ also hit its highs around 10:00 eastern and sold off but managed to close a hair above its 200 day SMA.

Many folks are still expecting a post expiry sell off and the SMH might be tipping the hand of the market by that red Friday close.