2.24.2006

PAINT DRY

The market ended where it started (again), energy faded into the end of day and hopefully next week will be more interesting.

RANDOMS

STOP TRADING


I miss cramer this week. Who else on TV or anywhere else can recommend over 600 stocks in about seven months and be considered a stock picking guru?

NIGHTMARE


Yes, the markets today like watching paint dry, as of 2:30 EST- the SPY has traded in a range of 59 cents- the QQQQ a whole 28 cents - a traders nightmare-

1:00 UPDATE

The markets continue to flatline and the internals have turned modestly green. GS continues in its northern flight. This afternoon probably brings more of the same- Flat markets. Note the Volatility Sisters are all red on the day down between 1 and 2.5% -

DIPS AND RIPS

In the early going this looks like another day to BUY THE DIP AND SELL THE RIP- The adv/dec lines are fairly flat and the other key market tells are somewhat bullish. Goldman Sachs, usually a good indicator is up a buck and change and the initial oil rip is starting to come in a bit.

STRONG ARMS

Dick Arms, a well respected market technician and the creator of the "ARMS Index" also known as the "TRIN" has comments this morning on realmoney that echo my own concerning the overbought status of the markets.

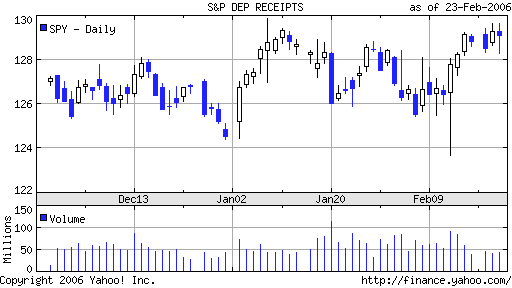
"We have a dichotomy between the Dow and the other averages. On Wednesday, the Dow, but only the Dow, went to a multiyear high. Moreover, a legitimate breakout is usually accompanied by much heavier volume and a widening trading range. We have had neither.

This, then, can hardly be considered a valid breakout, at least until the other averages confirm the move. In the meantime, the wide swings in both directions on the Dow in the last two days indicate increasing indecision after the advance that began at the end of January.

It is an indecisive market, but one that has had a good advance, and appears to be encountering resistance. I continue to believe some profit-taking is in order. "

RUDE CRUDE


Crude-oil futures ripped higher early Friday as energy traders weighed a report of an explosion in Saudi Arabia, escalating tensions in Iraq and a report of more trouble for Royal Dutch Shell in Nigeria against U.S. data showing the nation well supplied with oil and petroleum products.
Crude for April delivery jumped as much as $62.38 a barrel, up $1.84, after a report sourcing the al-Arabiya television channel of an explosion and shots fired at an Eastern Saudi Arabian oil refinery.

2.23.2006

TRADING BY THE VOLATILITY INDEX


If one looks at these two Indexes together, one can see a definite relationship between the VIX index and the SPY index. When the SPY goes higher, the VIX generally goes lower and vice versa. A good general rule is that when the VIX is stretched 10% or more from its 10 day moving average, its time to either BUY or SELL the indexes.

BANNER NIGHT FOR SOMEONE


Yes, that's correct. A banner night tonight for American Idol as the skaters do not live up to expectations. Sasha falls twice and comes in 2nd, and Slutskaya, the favorite, comes in third.

YUP

Twas a buy the dip sell the rip day as the markets closed just about where they opened with a couple of rips in between. As I have previosly mentioned, the markets rarely can get much jig when the Volatility Sisters are this oversold. Hopefully, we can get them back higher in the next week or so.

MORE STUFF

TUNED IN


Well that APPL/GOOG tandem was a pretty good tell that the market wasn't going to tank completely. Now the adv/dec lines have basically gone flat and there isn's much edge on the day- I suspect that both longs and shorts will be able to make money fading the dips and rips- Also note that the DJIA, as usual, is misleading at negative 50.

OUT OF THE GATE

So out of the gate we come and already the adv/decl finds 1k more losers than winners on the NYSE and 600 more losers on the Nazdog. The DJIA is down 46 giving back over 1/2 of yesterdays gains- Two green things catch my eye and usually they are a good "tell" for the market- AAPL and GOOG are both green- hmmmmm

QUESTION OF THE DAY

We have the quote of the day now we have the question of the day- Can she do it- We should know some time late this afternoon-

QUOTE OF THE DAY

Revshark on Real Money- states something that is not so obvious but it it true "In formulating a thesis about where this market is headed, we have to keep in mind this fundamental issue of individual demand for stocks. If the average investor decides that stocks are the preferred vehicle and starts shifting cash that way, it doesn't much matter what other arguments for or against the market there may be. Demand will reign supreme and all the most logical and compelling bearish arguments in the world are meaningless if people simple decide they like the idea of putting more money in to the market. "

I agree 100%- but one can still buy pullbacks and sell blips-

2.22.2006

RANDOM STUFF

Trading Techniques


A little more on my trading techniques- I like to buy lower and sell higher- One method - Follow the VXO - the volatility index on the OEX or the SP 100- If one looks back to January 20, the index spiked to about 14 when the 10 day SMA was about 11.8. The SPY was about 126, a fine time to buy. Today, the SPY is in excess of 129 and the VXO is under 11 and the 10 day SMA is just under 12. Probably a fine time to sell. If one looks at the VIX and VXN, the volatility indexes for the SP 500 and the Nazdaq 100, you will see similar patterns. So this is one method I use to buy lower and sell higher. BUY OR SELL ETF'S WHEN THE VOLATILITY INDEX'S ARE STRETCHED FROM THERE SHORT TERM MOVING AVERAGES More to follow-

Don't Have to Stop Trading


Well Jim Cramer isn't around today so we dont have to stop trading now- but, as mentioned in earlier posts, I certaintly didn't expect this move in the markets today- However, as I write, the CBOE Volatility Index is now under 12 and down 5% today. This is not a good buy point imvho. The VIX is now about 6% below its 10 day simple moving average. I think the sidelines suits me very well right now. I expect there will be better entries sooner rather than later.

PM Markets

The Markets are holding up better than i suspected they would- The adv/dec line the banks and the brokers hold up well while the semiconductors are beginning to give it up a bit-Also, the oil stocks may be worth a shot here - although inventories tomorrow- Everyone knows the there will be a build-

Morning Random Links

90 Minutes In

Well surprise surprise - The big caps are outperforming even with big oil stocks not participating- The internals on the NYSE are 800 more winners than losers and more flat on the NAZDOG with the 300 more winners than losers. The banking index is leading the way +1% - The Volatility Sisters are lower and to reiterate I dont think the market will get much traction from these overbought levels even with crude down a beaner-

Morning Markets

The Markets look like they will open little changed from where they closed yesterday. My take on the day is "lets see", but I am not expecting much- The market is still overbought, and my mantra is to buy low and sell higher.

BLACK GOLD

My good friend, Ed Stavetski, on one of thestreet.com pay sites, discusses his view on the oil debate- an excellent read for those taking the dark (short) side of the energy trade.


"The activities over the weekend regarding hostile activities in Nigeria only reinforce the view that the energy markets are a much more complex calculation than a simple current inventory sum. The dynamic now includes not only the U.S. and OPEC but emerging market countries and production in areas that are at best politically unstable. Add that to the fact that much of the OPEC supply is in hands that can best be described as volatile. National security, lack of alternate sources plus little in the way of discovery in the past few years is adding a large premium to the simple view of supply and demand. As I have indicated before, I do not see oil at $100/bbl any time soon, but OPEC seems to be prepared to defend at least $50/bbl. At any level in between, oil producers and refiners will see cash coursing through their corporate veins, which should also get reflected in their share prices."

2.21.2006

THE WRAP UP

The market simply went down in the early morning and pretty much sat there the rest of the day- Not much excitement (unless you were long the energy patch)- My take is that the Volatility Indexes are simply too low for the market too get much of a rally going- That coupled with last weeks rally and todays ramp in crude spelled problems for the bulls right from the get go- I for one will probably not be interested in the Long side of this market until SP 500 of around 1250/1260-

The closing numbers DJIA -46 NAZDOG-20 SNP 500 -4.3

2:00 PM Markets

Well the markets are just bouncing around here with the DJIA red by 42 and sp 500 red by 3.35- The jig in energy is keeping the snp as the best performing index- The adv/dec lines are still not finding any traction and i expect the markets to close around these levels

More Links

MIDDAY MARKET

Just before noon the mkt tried a bit of a bounce but ran smack into its daily pivot point and was rejected- the banks brokers and semis are all red and the Nazdog adv/dec line looks pretty ugly- the NYSE line looks a bit better - I think any rallies here will be sold-

Sharp Head Trader

As the sharp trader on the left noted in the earlier post, the morning strength has been sold heavily and she sees no reason to buy this dip yet!!!!

Gap Opening?

Looks like the Market is going to gap open this AM but rarely does it pay to buy when the Volatility indicators are this oversold- I expect this gap opening to be filled and then we will see what to do from that point.

Early Morning Fun

2.20.2006

DEFINITIONS - VOLATILITY INDEXES

The VIX is one of the investment industries most widely accepted methods to gauge stock market volatility. The first version of this index was developed by the CBOE in 1993 and was calculated by taking the weighted average of the implied volatility for the Standard and Poor's 100 Index (OEX) calls and puts. However, in Sept 2003 they revised it to give a more accurate depiction of broad market volatility. In essence, the VIX is a gauge of investors' confidence or non-confidence in market conditions.It is important to understand that the VIX does not measure the volatility of a single issue or option instrument, but uses a wide range of strike prices of various calls and puts that are all based on the S&P 500. What is formed is a more accurate measure of the markets expectation of near-term volatility.

The VXN measures volatility on the Nazdaq 100 index, the VXO on the OEX 100 and the QQV measures volatility on the QQQQ Nazdaq 100 tracking stock.

2.19.2006

The Blog Starts Now!!!!!!!!!!!!!!!!!!!!!!!!!!!!!!!!!!!!!!!!!!!!!!!!!!!!!!!!!!!!!!!!!!!!!!!!!!!!!!!!!!

Purpose of the blog – to provide some interesting commentary and maybe even help make some money-

My methods – Buy Low Sell Higher-

How do I know whats high and whats low- u will have to read on-

Is the market High or Low Right Now?

My indicators say High-

What are my indicators?

  • Volatility Indicators VIX , VXO, VXN, (stretched too far from their moving averages)
  • Moving averages of the net advance / decline line, and how far it is stretched from moving averages
  • how far SPY QQQQ IWM SMH etc is strectched from its short term moving averages
  • 2 day Relative Strength Index's (RSI) of the aforementioned ETF's in excess of 90 or under 10

When these indicators "line up" i will be buying ETF's or E Minis -

More on these trades as situations develope- Flat is the present course of action