3.24.2006

GONE FOR THE WEEKEND

I am about to leave for the east end of Long Island but before I go a few observations.

Every dip is bought and every rally is sold.

The Semi's are catching a bit of a bid as the SMH is green by 1% plus.

The metals sector remains strong as the HUI is now +3.5% and the XAU is +2.75%.

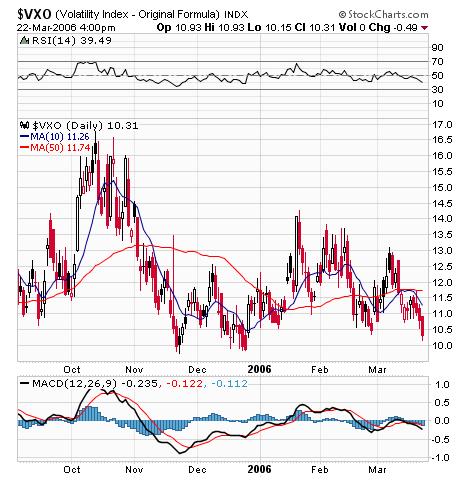
Volatility Sisters remain unchanged as usual.

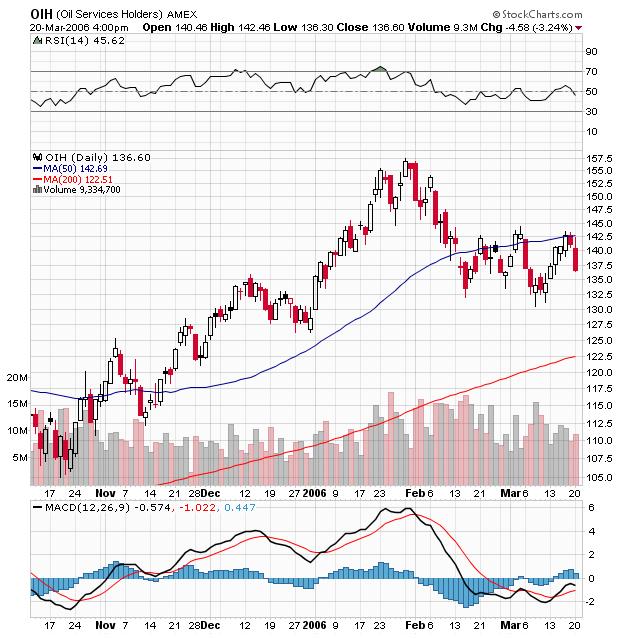
Market internals remain 1K to the green so look for more strength into the close. The Oils are higher again, but they are all over the place today so I have no hint where they are going to close.

SPY remains constrained by 130 to 130.4. Remember, buy lower sell higher.

2:00 NOW WHAT


The markets have drifted all over the map today and now they are about flat with the NAZ +7 and the SP+1. Internals are actually doing ok hanging in at 900 to the green side.

AAPL is right back to its old tricks down a buck after fooling us all this morning with the hope it would find support at 59/60.

Metals are still the sector of the day with gold up over 9 bucks. The XAU is +2.66% and the HUI is +3%.

Very interesting that the 10 year has drifted back down to 4.66% and if that gets much lower we may find some asset allocators (aka alligators) shifting from bonds to stocks.

My favorite market commentator who bottom ticked (sell sell sell) the refiners in mid February ( the one where he declared "I am not a joker") is now yammering that the natural gas stocks have to be owned here. He makes so many predictions and forecasts that some have to be right (no?).

REJECTED


The market is hanging in around noon time with the SP up almost 3 and the NAZ +11. The sector of the day is the Metals (+2.6%). Obviously GOOG is the big winner up 25 beaners (dollars). Market internals are also hanging at 1k to the green. The 10 year Bond is back down to 4.66% and it is now giving some juice to the builders. The SPY traded this morning down to support at 129.7 and is now hanging around at the initial resistance level of 130.4. If the internals hang tough at 1,000 plus, I would expect the SPY to make some headway north later in the day. The Volatility Sisters as usual are unchanged on the day.

The other big event of the day is the sudden turnaround of the OIH. It was again REJECTED at the 50 day SMA; after being up 2.5 points. It is now flat to pink.

One stock highlighted the other day SNDK is now up about 3.3% on the day.

MORE MAD MONKEY


I know that at times I harp on the Mad Monkey guy but this morning I was surfing around and saw some startling information in his Real Money book. It is RULE #11 and I had to read it twice to make sure that I read it accurately. Here goes:

"I never will buy a stock without first taking one off. That's a great discipline and one you should adopt, pronto. All the bad money managers I know have hundreds of positions. All the good ones have a few that they know inside out and like on the way down. "

That's why I say:


"Don't own too many stocks"


"When I lost the most money, by the way, my "sheets," my position sheets, were as thick as a brick. When I made the most money, my sheets were, well, one sheet of paper, double-spaced. And I ran hundreds of millions of dollars.
Please remember that whether you are a pro or an amateur, you can always have too many positions. Don't own too many stocks."

So Rule #11 is "don't own too many stocks." I agree 100% and I will not own a lot of stocks. My question; Why does he pick different stocks to own every night of the week on Mad Money, and why doesn't anyone ask him how he can so blatantly break one of his sacred investing rules. According to this site, he has now made 667 stock selections. I guess my second point is "he can no longer beat the market because he actually is the market."

10:30 EH

The markets sold off right out of the gate but have now reversed and the SP 500 is higher by 4 points and the NAZ is green by 13. The internals are a bit more mellow with under 1,000 more gainers than losers. The sectors worth mentioning are Oils and Metals (+3%)higher and homies lower. The 10 year Bond is back down to 4.69% and the Volatility Sisters are unchanged as usual.

GOOG the big winner(+7.5%) as far as individual stocks go with AAPL suprising to the upside by 46 cents.

Note that resistance on the SPY lies in the 130.4 to 130.75 area and support is of course at the low of the day of 129.7. The Pivot is 130 give or take a few pennies.

ANOTHER LOOK BACK - GWR

We looked at this stock back in early March and it has since split 3/2 and is now at all time highs. The IBD puts it at number 76 on its IBD 100 list which is quite an accomlishment for a railroad company. It has an EPS rating of 91 and a RS rating of 92. I still think it is an excellent stock to be bought on pullbacks to the 30.5 area.

FINALLY


The boys from GOOG finally get into the club and hopefully their arrival will be greeted friendlier than the appearance of MSFT INTC and HPQ in the DJIA index.

3.23.2006

THE CLOSE


The proof is now in. The DJIA has closed the day red by 47 and the market internals closed to the green by more than 100 issues(lol). Now you know that the DJIA is meaningless except to the talking head crew at CNBC. The NAZ and the SP500 both closed down a measly 3 points and I continue to believe and trade with the buy the dip sell the rip attitude.

The winners on the day were the Small Caps(+.4%), Metals, Homies (+2%), and Oils. The Semis started the day out well but faded into the close with the INTC morning downgrade.
I am curious to see if they can get them going again in the morning.

The Volatility Sisters were generally unchanged and are giving me no signal. The SPY bounced around all day between its Pivot Point 130.1 and support at 129.7. Hopefully tonight's basketball games and tomorrow's markets will be more interesting.

STOP TRADING


Check it out. Leading the oil stocks lately, the refiners. This is a chart of VLO and if you check a chart of FTO another big refiner, you will see that they both bottomed around mid February and have been climbing steadily since.

Our guy, the King of Stop Trading had this to say on his realmoney site on February 16, 2006:


"Ah, I see, here we go: the hobgoblin of consistency. Perhaps I changed my tune because four weeks ago, Valero was making a ton of money refining gasoline, and in the last four weeks, refining margins have completely and totally collapsed.

I mean like completely and totally. Like just disappeared. And you wondered why for many years refiners had the lowest multiples of any business except steel. Margins can collapse in a heartbeat. I am sure Valero is losing money on every gallon of oil it sells in California.
In these situations, earnings that might have been $10 go to $4. A stock that sold at 5 times earnings now sells at 12 times earnings. All that garbage about the refinery shortage and "no new refinery in 27 years" doesn't buy you a warm bucket of spit.


Of course, refiners are different from integrateds, which are different from drillers, which are different from drilling equipment companies. But the group still will trade monolithically off news in those, so accept the fact that the rough sledding will continue, particularly the more revenue they get from refining as a percentage of the whole.

Oh, and emailers: It's a tough game. Get used to it. I am not a joker, it's just that some businesses are funny in their own ways, especially refining."

Both FTO and VLO bottomed in mid February. One could not have gotten this more wrong. Trust me, he is a big time joker.

HERE WE GO AGAIN


The OIH is the big ETF mover of the day as it is again bumping up close to its 50 day SMA. That would be right at 142.5 and now we trade at the 141 area. The last time it hit the 50 day it immediately sold off back to the 135 area. Again, that 135 area looks like a good area to sell, sell short or sell calls. This time however, remember to sell puts when it gets back down to the support area (133/135). That has been the easy trade.

EVERY DAY FRUIT

I have been wondering about this stock for weeks and months now. Traders/Investors tell me on a consistent basis "one has to make a stand somewhere on AAPL." Most folks took a stand 5, 10 and 15 points higher and it continues to go down just about every day. It started when the CEO began appearing on the cover of just about every magazine available on the internet.

I have no idea when the pain will end or why it started but I am staying away until it really gets cheap(lol).

Back to the action, the markets also look like they want to make a stand here as the internals come all the way back to flat and the SEMI's hold tough in spite of the INTC cut. The leading sectors continue to be Metals, Homies, and Oils.

BUY THE DIPS SELL THE RIPS REMAINS THE NAME OF THE GAME.

NOON REVIEW

I hate to say it, but the SPY knifed right through the 130.1 Pivot Point and turned on the dime at support of 129.7 and it is now hovering under the Pivot. The internals are improving as I type and they are now back to 600 losers over gainers.

The outperforming sectors continue to be Oils, Semis,Homies andMetals. The yield on the ten year Bond is back up over 4.73%.

My take is the markets are range bound for now and dips are to be bought and rips are to be sold.

MORE FACTS

I was just reading one of my favorite trading blogs "Trader Feed" authored by Dr. Brett Steenbarger. He also writes for TradingMarkets.com and he has done some great research on market tendencies. His latest findings seem to emulate my trading strategies of buying lower and selling higher. Here is what he says:

"I'm following up on the broad market's countertrend tendencies. When my trend measure registers that the market is trending over X time periods, it appears that the next X periods tend to reverse this trend. I need to research this further but, if true, this countertrend equivalence could be a solid basis for combining time frames in analysis. In other words, let's say you had a strong downtrend reading on an intraday basis *and* on a multiday basis. That should provide an excellent signal for a longer-term market purchase.

I went back to March, 2003 (N = 766) and examined five-day trend readings in SPY and then what happened in the *next* five days of SPY trading. When SPY displayed a strong five-day downtrend (N = 104), the next five days in SPY averaged a gain of .80% (68 up, 36 down). That is much stronger than the average five-day gain of .31% (448 up, 318 down) for the overall sample. When SPY displayed a strong five-day uptrend (N = 196), the next five days in SPY averaged a gain of .17% (108 up, 88 down), weaker than the average five-day gain for the broad sample.In short, five day trends are tending to reverse."

This to me is great stuff and really validates (for now) my trading strategies. So when you see Bob Pisani et al yammering about new highs, fade em, and when they are depressed about the sell off, buy em.

ONE WORTH WATCHING


The major market indexes so far today are about unchanged. The ETF of the day (so far) is the SMH (OIH is always a big mover so it doesn't count), and if it can continue to move higher it will probably drag the techs and the NAZ with it. As I type it is up over 1%. Sticking out like sore thumbs to the dark side are AAPL/ GS and low and behold GOOG is up four beaners(dollars).

JOYG, an original pick from the IBD momo list is trading at a new high over 61.

There isn't much movement otherwise with the market internals flat. The long Bond is unchanged and the SPY Pivot Point today is about 130.1 and I would watch the activity around that level. Initial resistance is 130.75 and support is 129.7.

SNDK TECHNICALS

I was just reviewing the IBD 100 list and this stock stuck out. The stock peaked in January and has now apparently "bottomed" in the 55 area. What strikes me on the chart is that the MACD histogram bottomed in mid February when the price was higher. So the price is lower but the momentum indicators are higher. That is a positive divergence indicating the stock is probably now a good buy. It is also interesting that after plummeting 30% from its high, the stock still has an IBD RS rating of 90. The EPS rating never fell and is still at 98. Certaintly one worth investigating.

VXO GRUMBLINGS

There has been a lot of chatter lately about the low readings on the Volatility indexes. The above chart of the VXO, which is the original VIX based on the OEX 100 index is now quite oversold. It is about 8.5% below its 10 day SMA and with any further lift in the major market indexes will no doubt issue a sell signal of 10% below its 10 day SMA.

The answers as to why the Volatility Sisters are so low runs from too many hedge funds chasing too little opportunity to the market is just fairly valued. I do not know why the indexes can't lift on selloffs but I do know that buying when the indexes are overbought (110% or more above the 10 day SMA) and selling when oversold (below 90% of 10 day SMA) has led to consistent profits and I intend to stay the course and follow the signals.

GREY LADY

The New York Times came out yesterday with a disappointing earnings forecast and the stock sold off. That is one ugly 3 year chart especially in light of the 500 point move up in the SP 500 over the same time period . Any problems in media/newspaper land?I do not know how these "old" media companies are going to generate sales and profits in the future and I know we can all read just about any newspaper in the world on line free of charge. I don't think on line ads are going to do it and neither do the markets. That is one ugly chart.

3.22.2006

THE CLOSE


The market close was actually ok even though the SPY was again rejected at daily resistance of 130.5. The real bright spot on the day was the internals as they held steady and closed over 2,000 more to the green.

The Semi's hung tough in spite of the Vista launch delay with INTC rocketing 1% higher at the close. Small Caps up 1.5% is also a nice arrow for the bulls. Cramer bulling GS at 3:30 also didn't hurt.

Volatility still can not get off the mat and note AAPL red on the day in spite of the PC to MAC gibberish. The other meaningful market sectors were all up a tad on the day.

Until further notice, this remains a buy low(dip) sell high (rip) market.

EYE OF THE TRADER

Cramer just crushed the GS shorts as he mentions on STOP TRADING that it should be a $200 stock.

The 2 big tells of the day 1) the market internals never came in as the market came in, and
2) the semis never gave up and stayed green or flat all day.

Note the SPY movement at the Pivot Points. The SPY got back to 130, the point of the day and bounced and has now gone back to 130.5. That should be resistance. Lets see how that works in the next 10 minutes.

2:00 UPDATE


The one thing I see standing out this afternoon is the positive action in the Small Caps(+1%). The Naz is flat and the SP 500 is plus 4 or (+.3%). Uneventful to say the least.

The oil patch stocks have turned and may go red on the day given there is another 2 hours of trading.

Market internals are healthy at 1,600 to the green.

My only observation is that the market continues to be a buy the dip sell the rip environment.

NOON REVIEW


Well the Rejection lasted a little while anyway. The market is very resilient as it has now jumped over the Pivot and the next resistance is at the 130.6 level.

The market internals are now 1,350 to the green and most sectors have followed suit. The biggest winners are Small caps, Oils and Metals. The Bond is still sitting at 4.7% basically unchanged on the day

The Naz has turned green and my SMH trade is looking pretty good so far. The Volatility Sisters are still sitting on the floor and unable to get any traction. The favorite momentum stocks are higher with AAPL GOOG GS all green. Interesting how INTC is green and BRCM is red.

I have no clue why the market is rebounding so quickly from yesterday's ugly sell off but the market just does what it does and all we can do is try to profit from it.

REJECTED


Low and behold right at the 130 Pivot Point the SPY is rejected. The oil stocks were screaming higher on the EIA Inventory news and are now all over the board. The market internals have flipped to green, but they are also all over the place.

Market sectors are still mixed with yikes SMALL Caps leading the way(+.3%). Oils and Metals are higher, financials mixed, 10 year Bond unchanged and the Semis hanging in with SMH unchanged and the SOX down 3 points.

The Volatility ladies are another conundrum as they refuse to jump off the mat regardless of the moves in the market.

ARMS TALK


Our friend Dick Arms seems a bit worried this morning in light of his comments on realmoney. Dick says:

"It is still a very hesitant market. In spite of the breakout of most of the averages above the January highs, the Nasdaq has been unable to get anything going and is still fighting a resistance level.

Tuesday was particularly disappointing, as an early rally was erased and followed by a decline. Moreover, I anticipated more volume on a legitimate breakout than we have seen so far. The only heavy volume was on Friday after the breakout, when the averages were apparently encountering resistance. So far, it doesn't feel like a legitimate breakout that is likely to carry very far.


In the meantime, the Arms Index has moved up to somewhat overbought levels. As can be seen on the chart below, the moving averages didn't hit a dramatic extreme, and they have moved away somewhat from where they were at the end of last week. Nevertheless, they are overbought enough to provide an additional warning that all is not as rosy as might be thought by just looking at the Dow Industrials. I continue to hold longs, but very cautiously. "


Obviously, Dick is a bit nervous about the markets.

NO PROBLEM HERE


The market seems to be largely ignoring the MSFT Vista issue (was the reaction yesterday?) as it opens flat sans the NAZ which is very heavily weighted with MSFT. The market internals are flat and the Semi stocks which one would think would have a very negative reaction to this news is barely red. I have purchased some SMH (35.59) since the news seems to be ignored.

The SPY Pivot Point today is right at the 130 mark so also watch that point to see if they march through or get rejected.

The sectors moving so far include the metals (higher), Biotechs (lower) led by CEPH. There is no other movement worth noting.

PORKER

A heads up, this stock was recommended on STOP TRADING monday in light of the BIRD FLU madness by Jim Cramer. It has lost 10% of its value in one day since Jim uttered the symbol. A word to the wise: do not chase his stocks when he mentions them.

PICTURE TELLS ALL

Well Mr. Softee has done it again and the NAZ futures are reflecting the mood. MSFT delays the launch of Vista and maybe another delay of the always welcome (rarely showing) tech rally. It will be a very interesting day and hopefully we will be able to tell how anxious the dip buyers will be to buy in light of the new bull market.

One question I have is whether word of this Vista problem leaked out mid day yesterday causing the interday reversal. Inquiring minds want to know.

3.21.2006

RANDOM LINKS

UGLY CLOSE


That was one ugly afternoon. Bob Pisani now asking why we rallied earlier instead of wondering why the market sold off. Hey Bob, all of your cohorts tell the viewers all day long how great the markets look making new high 5 or 6 year highs.

Are you now suggesting one should buy lower and sell higher?

Anyhow all the major market sectors finished lower except for the Semi's. I am sure over the next few days we will here that the market has had a great 2.5 month run and we are/were due for a correction. The brunt of the correction was taken by the Small caps the financials and some recent favorites including AAPL GOOG and GS.

My eyes keep wondering over to the 10 year Bond which traded up to 4.72%. I think the markets will have a hard time going higher with the long rates up at these levels. Too much competition for stocks.

The worst news of the day is probably the action in the Volatility Sisters which all closed lower on the day. Hopefully we can get this washout out of the way soon and I can cover my SPY short and look to buy again.

STOP TRADING NOW!!!

Looks like we are going to have to wait a bit more time for the new Bull Market which was supposed to start on Friday. Everything has turned ugly with the market internals 2,600 to the red. The only winning sector I see are the hated SEMI's with INTC higher by 1%.
The unfortunate part of this ugly selloff is that the Volatility Sisters have all remained in the red. That is an ugly bearish sign. GOOG is down by 7 points and GS is down almost 3. AAPL also flipped ugly red now lower by 2.5 points. No matter how one slices it, this is an ugly session for the bulls. Hopefully, it will not be long before we get a short term signal and buy lower. I am hanging on to my Long QQQQ Short SPY trade for the meantime.

The jewel from the clown today is "GOOG is now a commodity and there is no need to buy". He likes wireless and is not bullish on INTC and the PC stocks. My favorite quote from him now is "wait to buy until we are oversold." What happened to the Bull Market that started on Friday? Oh well.

2:00 UPDATE


Stop Trading with Cramer today should be quite interesting as he really has nothing working. New Bull market, nah SP 500 red. Forget the NAZ, nah QQQQ and SMH green. Bird Flu stocks from yesterday, nah red.

Anyhow, the SPY got up to its daily resistance level at around 131 and turned tail and plunged right back through its Pivot Point at 130.5. Not a pretty day so far for the "buy em higher sell em lower crowd (it usually isn't). "

Looking to the major sectors, the SEMI's are leading on the green side and most everything else is mixed to leaning slightly one way or the other. GOOG is standing out red by 5 beaners and my other favorite GS red by about a beaner. Oils are slightly higher and the metals are a bit lower even in light of the positive news for the Silver ETF.

The Volatility Sisters are lower and that is not giving the bulls a lot of hope. The yield on the 10 year Bond has steadily climbed higher all day now up to 4.73%. I warned that the higher rate may be a problem in an earlier post.

The market internals have gone back to red with 1,100 more losers than winners after briefly turning green.

ANOTHER IDEA

The SPY has just blown through 130.5, the Pivot Point, and the next bands of resistance are at 130.8 and 131.20. Note however, how the QQQQ and the SMH are outperforming and even the NAZDAQ COMP is up 2/3% compared to the SPY .25%. Who would have thought that the Naz would outperform?.


Adam Warner at the Daily Option Report has an idea similar to my Long QQQQ Short SPY. His take, which is based on analysis from Jason Goepfert's at the Sentimentrader is as follows:

Last week, the BKX closed at a 2-month high on the same day the SOX closed at a 2-month low. What does this lead to?

Jason's findings:

"Over the past decade, this has been extremely unusual, as I show it happened only 3 other times......After those instances, the SOX had outperformed the BKX one month later each time, and by an average of nearly 13%.

Overall, market performance was mixed, so I don't think there's much we can read into this as far as a tell for equities in general, but in the past anyway the spread between the day had a tendency to narrow."

Adam's action:

"I am playing this spread small, leaning long in the SMH vs. short XLF. Kind of jibes with my opinions of the two right now anyway."

Note that the largest component of the SPY are the financials and as far as SMH, if they go up the QQQQ will generally follow.

MID MORNING OBSERVATIONS


The day continues and the bulls and bears are fighting it out and the winners so far are the Semis and the Oils which have flipped to the upside as W speaks. The market internals remain red with 1,600 more to the downside and if that doesn't change the indexes will not be able to gain much traction (duh). One note of caution that I see is the 10 year is now back over 4.7% and that will soon by yapped about in the media and on CNBC.

The financials are red along with the homies, metals, GOOG, AAPL and GS. The Volatility Sisters are about unchanged so no signals coming from them.

Also, note the Pivot Point on the SPY today at 130.5, if they can charge through, there is probably further upside. If it is rejected, then probably lower.

The BIRD FLU stocks of yesterday as screamed by Jim Cramer, SFD and PORK are both trading in the red (shocker).

10:00 UPDATE

The markets are all lower this AM sans the meaningless DJIA. The one stand out on my screen with big GREEN BARS is the SMH. I believe Cramer did give the buy signal on Friday when he said

"I say, forget about the Nazz for awhile. It's the big listed guys' turn. That's enough to do the job, and for once, accept that stocks are really and truly breaking out. While Marvell and Broadcom were leaders, it's their time for a breather. No more than that."

The Semis are the only sector so far today that I see as green (+1%) although it is early in the day. Everything else is lower with the Metals taking a real hammering down 2%. The market internals are 1, 500 to the red and the ten year bond is trading back up to 4.68%.

OIH TECHNICALS REVISITED


On thursday, I discussed the possibility of shorting or selling calls against the OIH because it had hit a potential resistance point at the 50 day SMA in the 142 area.

Sure enough, the OIH got as high as 143.5 and has gone straight down since and is now in the 136.6 area. If history is any guide the shares may trade to the 132 area and stabilize. Interesting how the 142 area has been resistance on the OIH since mid February.

I am short the OIH and my strategey will probably be to sell puts in the low 130 area (prior support).

3.20.2006

INDICATOR UPDATE

Just wanted to put together a little summary of where our 2 day RSI's are for our Index ETF's and update the status of the Volatility Sisters in relation to their 10 day SMA's as of todays close:

QQQQ 41.54 2 day RSI 71

IWM 74.1 2 day RSI 86

SPY 130.39 2 day RSI 61 (adjusted for dividend)

DIA 112.69 2 day RSI 87

VIX 11.8 10 day SMA 11.95 NO SIGNAL

VXO 11.04 10 day SMA 11.61 NO SIGNAL

VXN 15.83 10 day SMA 16.58 NO SIGNAL

Bottom line is that there is not much to do right now although I am holding long QQQQ V short SPY.

330 UPDATE


The markets continue to tread water and I think the longer they do the greater the probability of a sprint higher led by the NAZDAQ(later in the week). The Oils have gotten crushed today and that may help the general equity markets. Market internals are still sitting at about 400 to the red with the NAZ issues outpacing the NYSE.

The other things of interest are the homies red and the ten year rates down which is a bit of a conundrum.

The financials are flat and the upside gainers are led by everyone's favorite short GS now trading at 152.45 (+2.07) and GOOG at 348 (+9).

And now for Kramer, bulling PORK and SFD. These may be good but I wouldn't buy them today. They are both way up on "BIRD FLU" issues as the anti bird flu stocks. My strategy, if I wanted to own them, would be to buy them on a day when no one is talking bird flu.

WORLD SERIES UPDATE


The markets are crawling back at the 1:00 hour with the internals trying to get back to the flatside. The strongest ETF's, yes, you have guessed correctly, the QQQQ and SMH. Also on the upside are Small caps and Metals. The flatish sectors are biotechs financials and the Volatility Indexes. GOOG still stands out to the upside.

One question of today is Why does TheStreet.com publish and tout Lenny Dykstra's Option ideas.?

If you don't know, Lenny (nickname NAILS) was a very good center fielder for the New York Mets and the Philadelphia Phillies back in the 80's and 90's. Lenny was known as a hard nose player who ran fast, played hard and always had a dirty uniform. What I find confusing is why this correlates to making money in the options market. Buying deep in the money calls may be a good idea if some cheap puts were owned or some stock was shorted against it. To just buy the calls and wait for the money to roll in is a risky proposition. We all know that one or more of these stocks will blow up and the "inexpensive" options will expire worthless.

So my question is why does thestreet.com hire Lenny to write this column when there are many qualified option traders who have as much or more experience trading as Lenny did playing centerfield. I guess its the entertainment /novelty value of having an option trading World Series winning ex centerfielder. For more on the silliness, please read today's Daily Option Report.

MORE SHARK

Revshark on realmoney is offering up his thoughts on trading from the short side and I happen to agree with him. My experience is, especially lately, that short trades are quick. They can go against you fast and you do not want to be run over. Here is the rev's take:

"One of the other problems that I have with short-selling is emotional. I find it much harder to have strong convictions on the short side when a stock is moving against me, as opposed to staying confident in a long-side trade that is being uncooperative. Shorts simply feel more vulnerable than longs to me, and thus I don't trade them as well. One of the other issues on shorts that I have found difficult is that the timing isn't simply the inverse of what you find with a good long. Good shorts tend to fall fast and suddenly, while good longs tend to play out more gradually over a long time period. Hence a more anticipatory style works better for shorts than for longs. I have no qualms about admitting that I'm not a big short-side player. I simply have not found that focusing primarily on longs is a handicap. Even in the dreary market environment following the bursting of the bubble, I still made decent money on the long side. I disagree strongly with the opinion some hold that to be a great trader you need to be able to trade effectively both short and long. I know traders who do just fine with a focus solely on the short side, and I know traders, including me, who do fine with a focus primarily on the long side. "

I find that if I buy the pullbacks when the indicators set up I really do not need to short. Besides, I see short side traders constantly get run over by the likes of DHR GS SPY etc and it is no fun.
I remember one guy who was constantly shorting TOL and when it finally cratered he was no where to be found.

BORING


There is nothing going on in the markets today as the NAZ and the SEMIS are slightly higher and the SP 500 is slightly lower as are the financials. The market internals are red with about 1k more red than green. Small Caps, Oils, Homies and the 10 year yield all lower. The bright spot is GOOG and the NAZ Volatility Index. I guess all the talk has turned from the 9:25 jibberish of "the markets are looking terrific here approaching six year highs" to the 11:30 jibberish of "I guess the markets are due for a breather here after the recent run to near 6 year highs."

I have shorted more SPY against my long QQQQ and so far that trade is working just fine, thank you JJC.

10:00 UPDATE

The new Bull Market is not off to a riproaring start today. The SP500 is +1.35 and the NAZ is +6.5. The big stand out so far today is GOOG +8. Small Caps are flat, Semis, Oils and Metals are higher; financials are mixed with GS up a beaner and a half. The market internals are mixed to red and JOYG mentioned this morning as a lookback is trading at a new high.

A LOOK BACK


Back in the beginning of March, I mentioned 5 stocks that looked like interesting buy candidates. I suggested that these stocks were near their highs and could be bought on pullbacks. The first up is JOYG and it is up a bit and if the pullbacks were bought there are now good gains to harvest.

3.19.2006

CARNIVAL BARKER


Just a few more Cramer tidbits. In light of his prediction on Friday about the start of a bull market, I wanted to point out some of his other documented predictions. He has continuously been over optimistic with his forecasts. Even with the bull market that started in March of 2003, he has still been way to high with his DJIA forecasts. Read for yourself below:

On January 2. 2004, Jim predicted this for the Dow Jones Industrial Average as of December 31, 2004:

"Add up all my projected gains for the stocks in the Dow Jones Industrial Average and you get a price north of 11,300, which gives me my thousand-point gain -- at a minimum.
Not bad, not bad at all. "


The DJIA ended the year at 10,783, about 500 points lower than Jim's optimistic target.


On January 10, 2005, Jim predicted this for the Dow Jones Industrial Average as of December 31, 2005:


"Anyway, these target prices yield 12,547 for the Dow in 2005, which represents a 16% increase over where we are now. Not too shabby; in fact, it looks like another good year, especially if you are not a contrarian."

The DJIA ended the year at 10,717 a mere 1,830 points lower than what Jim predicted.

The bottom line is we had a nice bull market over the past 3 years and Jim has been far to optimistic and he never gave any predictions for Small Caps which is where the real action was.

RANDOM WEEKEND LINKS!!!

So this is Hillary's Original Challenger

More on Negative Divergence

More Evidence on Global Warming!!!

The Markets Really have been Dull!!!

Beating the Coming Bear Market!!!

More on the Housing Bubble!!!

Kenny boy Knew all about it!!!

Dorfman on EBAY and MSFT

The $1 BILLION Dollar Bill

$30,000 From Everyone

60% Say War Not Worth It

Neverland No More

Dionne on Feingold!!!

Why Retire Rich?

Work Smarter!!!

More Research from Dr. Brett!!!

Another Stock Market P/E Study!!!

Where are They Now?

Another take on SOX!!!

Are The Big Caps Back?

Allawi say YUP We are in Civil War!!!