3.03.2006

TECHNICAL CONDITIONS


The SPY closed friday at a bit under 129 and at a 2 day RSI of about 35. The 10 day SMA is a shade over 129 so for now it appears its just time to hang on and wait and see what the action brings us for monday.

The VIX closed at 11.96, right at the 10 day SMA. Its indication is to wait and see as it is right in the middle of its 10 day range.

THE CLOSE

The market closed near the lows as it made a complete reversal opening at the lows, moving up to the top of the recent range, SPY 130 and back down to SPY 129. About 1,000 more losers than winners after the breath turned positive briefly at midday. My thoughts are that a lot of traders bought the early morning dip and flipped them out into the 2:00 ramp. It is not untypical for traders to flatten out on friday afternoons. The Volatility indexes were up a bit on the day but offer no buy or sell signals.

CRAMER TIME


Yes its Cramer time, the man himself with 377 to go to reach the magic 1K level is up talking about commercial real estate (VON) and the little telecom guys JDSU CIEN BKHM. He of course doesn't mention how he recommended the disaster du jour, INTC much higher and in his 2006 forecast he gave us a $31 price target. He remains the guy on the left.

TAKING SOME OFF


The markets are approaching monday's highs and I have just sold down some SPY and QQQQ - I bought lower this morning. The Volatility sisters haven't generated any sell signals yet, the 2 day RSI on the SPY, however is now back up to 85 and its friday.

Mighty Impressive


Well its not even 1:00 PM eastern time and this guy on the left is mighty impressive. Lets see, he has shaken off the higher rate jittters, an intel dissappointment, iran jitters , iraq jitters , bad retail sales, housing bubble bursting, inverted yield curves, W's lousy approval ratings and anything else the bears can throw his way. Not sure why but it seems like folks just want to own equities.

Random Links

11:00 Peak


The gap was filled as all the dippers bought the gap down and then sold into the rip higher. The market internals have flipped to only 1600 more red than green. Our great market watcher Bob Pisani of CNBC fame, notes the poor performance of interest rate sensitive stocks like reits and homebuilders obviously alluding to the continued rise in long term rates. He did not mention why the brokers, also interest rate sensitive, have flipped green with GS being up a beaner and a half. Quesition for the bears, if the economy was going into recession because of the inverted yield curve, do we now avoid one because of the rising long term rates? Inquirinq minds want to know.

JUST COULD NOT RESIST


Yes, I just could not resist. The market gaps open lower and now we will see if they can close it. The brokers trade green and the semis off the Intel "crushing" down 25 cents hang in nicely. The market internals show 1800 more red than green but getting better as I watch.

HOPEFULLY NOT


Futures are way down this morning on the breaking news from Intel. This stock has been a house of pain since Cramer started recommending years ago. Hopefully its not inside your portfolio. Revshark on the realmoney site is mentioning how he is buying the QQQQ on this dip. I think I will join him.

NOT THE GAP


No we are not talking about same store sales, however it is OSCAR night on sunday and here are the winners (mine anyway) Brokeback, Lee, Witherspoon, Huffman, Giamatti and Weisz.

3.02.2006

TECHNICAL INDICATIONS


The VIX chart above tells the story (to me anyway) that the market is neither overbought nor oversold. The VIX sits just about at its 10 day SMA and the 2 day RSI is approximately 47. So hopefully we can get some jig and this index will collapse and maybe we get the sell high signal that we are seeking.

The spy chart tells a similar story as the closing price is about 30 cents higher than the 10 day SMA and the 2 day RSI is at 65. The sell signal kicks in when the 2 day RSI hits 90 or higher.

THAT IS IT


The bulls and the bears fought it out today and in my view there was no clear winner. There were about 800 more losers than winners and surprisingly the QQQQ closed the day unchanged. The SP 500 was red by 2 and the irrelevant DJIA was red by 28 coming up from its lows. The big deal of the day was the rise in interest rates and the liftage of the metals. I would not be surprised to see a nice rally in the equity markets tomorrow if the rates come in.

STOP TRADING AGAIN


Jim says he goofed with the retailers blaming momentum hedge funds for taking them down. He loves LOW and HD and the hard good retailers and of course Oregon Steel- He is still bulling JDSU and CIEN thinking there are shortages for telecom equipment. Stay tuned later today for some Mad Money picks as we slowly approach the one thousand mark.

WHITE LIGHTNING


The story of the day so far is the action in the metal stocks and primarily silver. PAAS SSRI GLG GG MDG all ripping higher. The equity markets are having a poor day as the internals show about 1600 more losers than winners. The semis, brokers and banks are all mildly red and the vol sisters are all moderately higher on the day. Interest rates are most likely crimping equities as the 10 year bond is about 1% higher on the day. I still think its a buy the pullback market until the market tells me something else.

Noon Time Update


Looks like the bulls and bears are duking it out and not sure who is gonna win this one today. The market internals are hanging in kinda with 1200 more losers than winners. The brokers are giving hope to the bulls as they stay green with GS up a buck and a quarter. The SOX and the Nazdaq indexes have turned red and the oils are selling off from this mornings rip higher. The Volatility indexes are all higher but not giving any signals to act on just yet.

BLACK GOLD

Today oil stocks are definitely black gold. However, note that now they are a shade above the 50 day SMA and right at the 90 2 day RSI level. Probably a good time for the traders to take some off the table. Back to the general markets, the DJIA has regained much of the earlier losses and the NAZ has turned green. The adv/dec line has also turned a bit although not quite in green territory yet. The Volatility indexes have fallen back after being higher earlier. It looks like investors just want to own stocks and buying pullbacks is the name of the game for now.

10:00 Update


The markets have opened lower this morning as retail sales were generally a little short of the mark. The Gap (GPS) turnaround seems to be stalling out as the SSS came in at -11%. The DJIA is -43 the SP500 is -5.5 and the Naz is -8. Oil stocks are generally higher but the OIH etf is climbing up against its 50 day SMA so it wouldn't be surprising to see the oil stocks take a break.

More Volatility Trading


The above charts are 3 month charts of the VIX and VXN the volatility indexes of the SP 500 and the Nazdaq 100 respectively. The 10 day SMA of the VIX is 11.81 and the sell area (10 % below the SMA) is approximately 10.65 as of today, so there may still be more upside to the markets. The VXN target is approximately 14 so again further upside may be in the cards for the QQQQ. Note that these are moving averages so the targets change daily and the rules are guidelines.

3.01.2006

The 2 DAY RSI Indicator

Above is a large chart of the SPY with a crisp RSI indicator above the chart set at 2 days. One can see how useful this trading method can be. If one were to buy the SPY when the RSI indicator was near 10 and sell the SPY when the inidicator was near 90, one would have done rather well . Of course it is always hard to buy when the price is low and their is fear that the price is going lower. Most prefer to buy when stocks are moving up and appear to be going higher. I think the picture above is worth many words. A good system that can maintain a buy low sell high discipline.

All About the Close


There it is and the markets close near their highs of the day. The semiconductors, the oils and the small caps led the way. My trusty volatility indicators sold off hard but they are not yet telling me to sell stocks. I suspect we get that word tomorrow or friday. The DJIA closed +60 the Naz +33 and the SP500+10.5. Most of yesterdays losses have now been recovered. Note also the 4% gain in the SMH etf. That used to be a leading indicator. Not so sure anymore. One final note, Bob Pisani on CNBC looks very happy.

STOP TRADING


Getting tired of Cramer posts but the show must go on. Jim today bulled GG and said NEM was a dog. I must say I agree. NEM always seems to have the wind at its back and constantly fumbles the ball always blaming something while other gold cos do well. He also defended GOOG saying their CFO should go. Quite anxious to see his picks tonight on Mad Money (614 and counting since July 28, 2005).

3:00 Look

The markets continue higher with the small caps and technology leading the way. Our trusty Volatiliy Indexes have sold off big time with the VXO and VIX down 8.5% and 6% respectively. They haven't reached sell targets but they are sinking fast.

The Pisani Factor


The markets have continued a slow climb higher and have regained much of yesterdays losses. I think the adage is buy lower and sell higher. One sell point may be when Bob Pisani comes out this afternoon smiling and happy. Buy when he is sad and sell when he is happy, seems to work regardless of the numerical indicators.

Morning Look

The markets are bouncing back modestly with the oils and semis leading the way. The internal adv/dec lines are also modestly green with about 1,000 more advancers than decliners. Goldman Sacks is leading the brokers modestly higher. Not a riproaring rally but hanging in for now. The DJIA is +33 Naz +9 and the SP500 +4.

BIG ARMS


Dick Arms is saying this morning on realmoney that this may be a pretty good time to buy. His reasons are as follows "Monday's advance, while not large, was enough to put the S&P 500 to a new multiyear high and confirm the move in the Dow. The same was seen in the Russell Midcap Index. The Nasdaq did not go to new highs, but it broke out of the downtrend of the last few weeks. All these signs pointed to a market that was starting to look better. Moreover, the Arms Index moving averages were remaining in neutral to oversold territory. Tuesday's sharp decline did not really change the above observations. A very high Arms Index value was generated, which served to push the five-day and 10-day moving averages to more oversold levels. In my last three columns, I have advised aggressive traders to take some profits, because the rise looked overdone on a short-term basis. But Tuesday quickly eliminated a large number of those sellers. I believe we are getting close to an opportunity to put on new long positions. "

He is apparently echoing my views with his oversold ARMS index observations. Many indicators are now lining up for a short term bottom.

2.28.2006

NIBBLING NOT TRIMMING


The markets sold off hard today and the prevailing market rationale was Google and the comments of their CFO. I do not know if that was the reason, but I do know that buying the market tomorrow (lower) is a better idea than buying yesterday (higher).

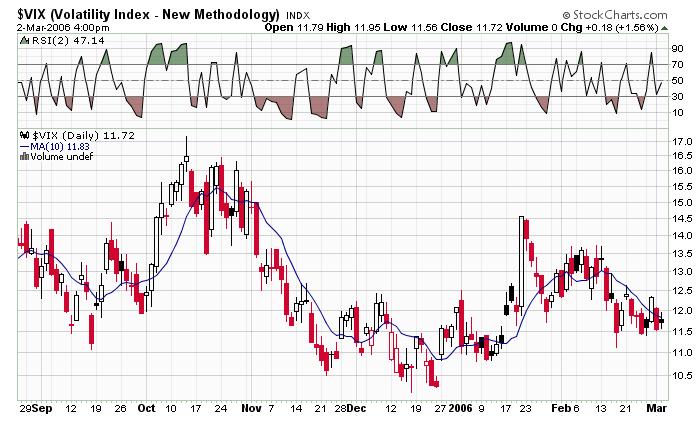
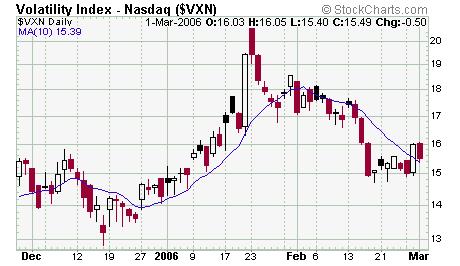
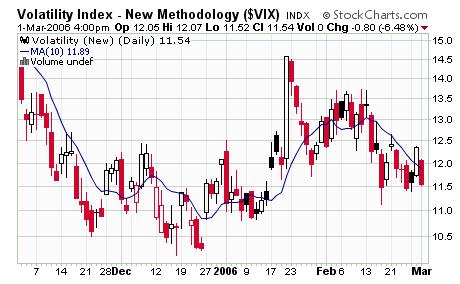
Some of the indicators I look at are the Volatility Indexes. I want to see where they trade in relation to where they traded during the prior 10 days. The group at Tradingmarkets.com has done studies and has found that buying when the VIX or VXO are 10% above their respective simple moving averages to be good entry points. The absolute number is meaningless. What matters is where they had been during the prior 10 days.

Currently, the VIX is at 12.34 and the 10 day SMA is 11.96. The VXO is at 11.84 and its 10 day SMA is 11.21.

The 10% above rule was not reached today, but if the markets sells off again tomorrow we will probably hit the 10% target.

My method is not to wait but to scale into buys in the ETF's. If they go lower I will buy more knowing that a short term bottom is probably close.

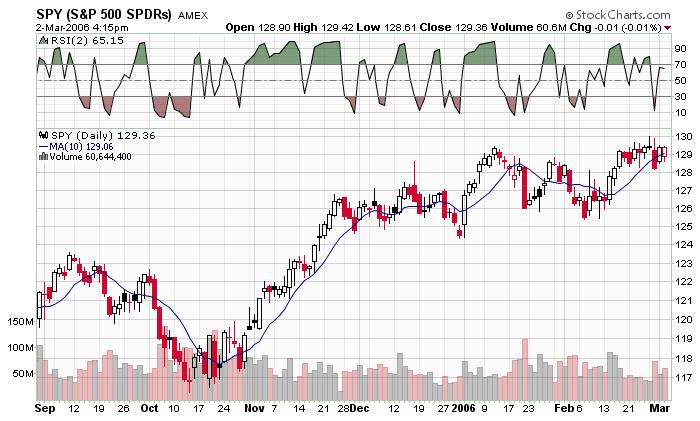
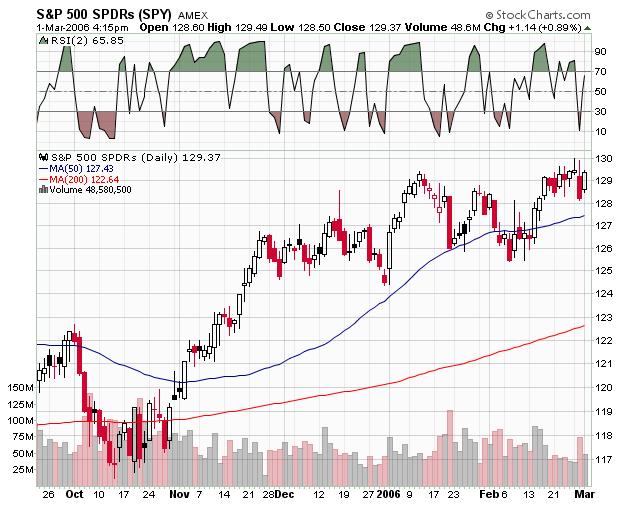
Another indicator that I utilize and have mentioned is the 2 day RSI. Tradingmarkets.com has also tested this methodology and has found excellent results when buys are made based on this indicator. This rule is basically buy ETF'S when the 2 day RSI is below 10. The RSI is an indicator that is in all charting packages. Just switch the input to reflect a 2 day period instead of the standard 14.

The SPY closed the day at a 2 day RSI of 12 and i "nibbled." If they go lower, I will buy more.

These indicators and rules are fairly simple and generally if they line up we get good entry points (to be able to sell higher).

I also use some other indicators to generate buy signals and I will discuss them in future posts.
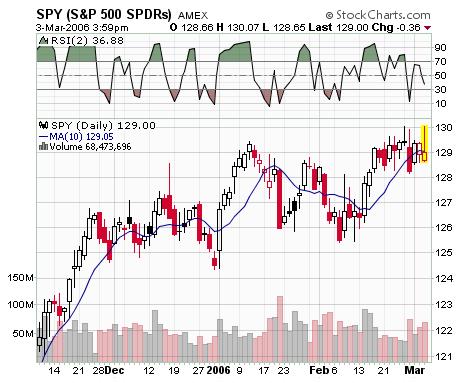
Markets Close

And there it was. A stock crushing, thank you GOOG. The DJIA closed -104 Nazdaq-26 and the SP500 -13.5. These indexes closed at not quite the lows of the days but ugly enough. The indicators I follow reveal a bounce is probably due and I would not advise selling here. The Volatility Sisters ran up on the day and they are no longer in oversold territory. The price action reveals the markets are close to a short term bottom. Remember, the trick is to buy lower and sell higher. Bob Pisani of CNBC fame was all excited yesterday about how well the market was acting and I thought it was a nice short term sell sign.

STOP THE MAD MONEY INSANITY


Stop listening to this guy now. I think the image is fitting, especially in light of this mornings prescient GOOG advice. For the Mad Money addicts, be aware that Jim has made 611 stock recommendations since July 28, 2005. If we get some luck and if he doesn't take too much time off, we should reach 1,000 by the summer. Just makes one go HUH- Where is the value of recommending 1,000 stocks in one year?

Pre Stop Trading Now Random Links

2:00 Markets

The markets continue lower as of 2:00 EST- the DJIA is -102 the Naz is -23 and the SP500 -13 The market internals find 2500 more losers than winners and just about all sectors of the market are lower. Generally, I find that the market will not go down more than 15 S P 500 points in one day and we are just about there. Also, remember that markets that are weak all day tend to close on the lows. One bright light here is that the VXO, the Volatility index on the SP 100 is is higher by about 13%. Hence, we may near a short term bottom.

GOOG DUMP


Well as I have been saying for a few days now, the market is overbought and due for a pullback. Here is the pullback with the apparent catalyst being the GOOG CFO comments indicating that "growth at GOOG is slowing." That is the last thing the growth and momentum investors in GOOG want to here. Also, as of now the SP 500 has lost 18 points since yesterday's Pisani high. The good news is that the Volatility Indexes have ripped higher on the news and before long we will have buy signals.

10:00 Peak


The markets have opened lower. The DJIA is -37 the SP500 is -7 and the NAZDAQ is -8. The adv/dec lines are red as there are about 2250 more losers than winners. The oils and metals have also opened lower. Seems like there is no where to hide as the markets are all overbought.

2.27.2006

The Close

Well, for those who bought the SPY after 11:00 AM you are now underwater on the trade as the markets treaded water from that point and faded into the close. The banks and brokers could not get anything going and the internals closed a little green. Again, the market here is a better sell than a buy as it is overbought IMVHO.

STOP TRADING


Thank goodness Jim is back from winter break today. I am hoping we can get ten or twenty recommendations from him this week so we can get to the magic one thousand mark sometime this summer.

As I watch the markets, I note that the internals (adv/dec lines) are about the same place they were after the markets opened. So there hasn't been much of a rally since 9:30 regardless of what Bob Pisani may be saying. The banking and brokerage indexes are fairly flat and the market will not go far without them. I want to reiterate my morning comments, its a better time to sell than to buy.

Pre STOP TRADING NOW Randoms

Another Quote of the Morning

A commentator on realmoney is now trying to steal the Quote of the Day by offering his take on the state of the markets " I'm staying rather aggressively long over all, but I'm definitely becoming a net seller rather than a net buyer in the last couple days. Shorting some index hedges again too, after, as I'd noted, taking off most of those hedges a couple weeks ago. Just some disciplined scaling as much as anything. " Not sure what one can add to commentary like that.

Mid Day Market


The markets have gotten a little jig this morning on what appears to be lower oil prices. However, the 2 day Relative Strength Index of the major market ETF's (SPY QQQQ IWM), are now over 90 ( more on this indicator in a future post) . That usually means it's a good time to sell. Couple that indicator with the stretched Volatility Sisters ( to the oversold areas) and it looks like the markets are due to pullback.

10:00 Update

The markets open and it looks like the S P 500 is at a new 52 week high- The QQQQ has regained its 50 day SMA- The semis have rallied to green shaking off some downgrades and the internals of the market (adv/dec lines) are moderately green- Oils and metals are lower-

QUOTE OF THE MORNING

Todd Harrison, a market maven and founder of Minyanville.com, noted the following this morning " If the markets are near five year highs in the face of nosty Iraq news, a looming Iran fuse, massive debt, foreign dependency, evolving stagflation and presidential approval ratings unseen since the Nixon era, what does that say about the moxie of the underlying bid? ." A pretty interesting observation from a very savvy minyan.

2.26.2006

Weekend Randoms