8.25.2006

TECHNICALS XBD/BKX


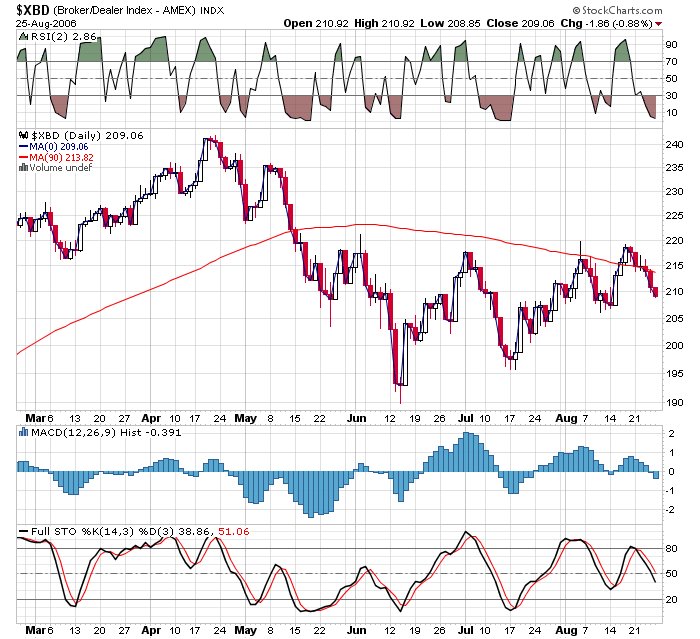
There they are, blogger photo working again.

Those charts of the financials none too pretty as the major indexes try to rally. Not going far without these two sectors.

THE CLOSE

Another day where the markets closed not far from where they opened with market internals basically flat on the day.

Leading sectors were oils, biotechs, metals and techs with losers being financials, internets and airlines.

Big Bob Pisani constantly talking about the recent big cap outperformance and he is right. Take note of these index returns from May 1:

SPX 1305-1295

RUT 761-699

QQQQ 41.44-38.32

COMPQ 2305-2140

DJIA 11,343-11284

See anything standing out? Yes, they are all lower with the big caps doing less bad. Anyhow, more bad news, check out the charts of the BROKERS XBD and BANKS BKX (blogger refuses to allow me to upload). Pretty ugly and I am quite surprised Bob doesn't mention how poorly the financials are fairing in light of the performance of the major market indexes. Bad news does not sell all that well on CNBC as they always try to find a silver lining. Note today how they even mentioned the outperformance of the OEX a large cap index I have not heard them mention in years. Whichever index is going well will be sure to get a mention on CNBC.

Just remember, if the Banks and Brokers aren't going higher, the major indexes are not going higher either.

TECHNICALS-QQQQ


Markets continue to trade mixed with the market internals flat with metals oils and biotechs leading.

Just a heads up that the QQQQ may be getting a sell signal here as the ETF is bouncing of its downtrending 90 day SMA at the 38.6 level.

The VXN volatility index is trading more than 10% below its key 10 day SMA at 17, so another sell signal. Just a warning that the VXN signals are less reliable than the VXO/VIX signals as the index is much more volatile. The 5 day RSI of the VXN is also way oversold with another Larry Connors sell signal at 22.

Another tell that is giving me comfort in these sell signals is the action in the financials. Pull up charts in the BKX and XBD and you will see what I mean.

Bob Pisani with the key observation that big caps are outperforming small caps as the SPX is slightly higher while the IWM is only slightly higher. Hey Bob, the DJIA is lower unless of course there are no big caps in that index.

BIG ARMS


My apologies as Blogger is playing havoc with my posts today.

Anyhow, markets continue to trade mixed with DJIA/IWM lower and NAZ/SMH higher. Market internals are flat after being materially lower (the open) and materially higher (early morning).

Sectors doing well include oils, biotech and some tech. Sticking out on the downside are DJIA stocks, small caps, banks and brokers.


The sloppy trade in the financials is sticking out like a fat thumb today as GS continues to trade lower while the NAZ is higher. The markets are going to have problems making an upward move without the financials and the small caps, so if you buy keep it on a tight leash.

Dick Arms had some interesting comments on real money and he echoes some of my bearish view:

"The ambivalence continues. In the last week, we have had very little action in either direction, and volume has come to a screeching halt.

Call it the summer doldrums, but it looks more as though the Street is confused, and therefore reticent to move. Such indecision is usually the calm before the storm. We will eventually see a decisive move in one direction or the other.
But which direction?


The evidence seems to suggest it will be down rather than up. We looked in Tuesday's column at the VIX and the fact that it suggested a downturn. Shown above are the five- and 10-day moving averages of the Arms Index. They, too, are overbought and hint at a downturn.
Most important, perhaps, is the action of the averages on Wednesday. The downturn was enough to penetrate the bottom of the narrow trading range, before rallying back into that range. That, too, suggests the next move will be down rather than up. I remain cautious."


The volatility index tandem of VIX/VXO continue to trade at the bottom of their recent range although not oversold enough for a sell signal but they are on the radar as another bearish tell.

Again, I expect the market to turn south after Labor day as the seasonals turn bad and there may even be a warning thrown in to boot.

THE OPEN


Markets are gaining momentum with the early winners being oils, metals, bios and small caps. Internals show 1,700 more winners than losers and if the small caps and techs can keep the lead, the markets may make some headway today.

Many were expecting a quiet market with rallies sold and dips bought but so far a bit of an upward surprise.

More gibberish from the CNBC "journalists" about a soft vs. hard landing. Not sure how they define each but I suspect that both are eventually bad for equities.

More new from our friends in Iran as the IFX say "Iran soon to announce new nuclear achievements." Aren't they just the best.

8.24.2006

NON BIZARRO WORLD


Is the investing world heading back to common sense where bad news is in fact bad and good news is good? Not sure, but the long bond is back at 4.8% indicating the bond guys are expecting a weaker economy and they are usually better forecasters than the stock folk.

The stock guys wanted the fed to pause and that they did and the market rallied on the heels of the good news that was probably bad news as the economy is/was weakening.

On the inflation front, the data changes often and at times seems good and other times bad. Bottom line, the fed heads will be more concerned with the state of the economy and the markets than inflation as the all important 2006 elections get closer.

My point, the news will probably get worse in spite of the CNBC contention that earnings are good and will probably stay good. Yes, they are good but I suspect that earnings growth will slow and hence the "low" P/E's that we have now will not be perceived as that low when the growth continues but slows. Companies will be perceived as less valuable if the rate of their earnings growth slows.

The also often mentioned CNBC hope of large cap outperformance is probably right around the corner as the shape of the trend lines turns south. Big caps will outperform the little guys when the markets head lower although I don't think that is what the CNBC "journalists" mean when they say big cap outperformance.

And isn't it interesting how now the "journalists" are trying to shrug off the lousy housing/personal economic numbers by anticipating that business spending will improve and therefore the economy will continue growing. Funny how they said the reverse when business spending was slowing (if anyone remembers).

My take is that there will be opportunities on the long and short sides but for now I anticipate the period after Labor day and through the middle of October will be challenging for the longs.

CHOPFEST

The Slow Go was the most appropriate post of the day as the markets go nowhere with the dips being bought and the rallies sold.

Specific sectors outperforming include the SMH as they trade up .9% with Oils homies and drugs all finishing green while brokers, retailers, trannies, internets and metals close red.

And now that we all made money on the Frank Quattrone and Plan B approval news, we can really clean up on the news that Ford may go private. Perhaps only another 8 to 12 hours of CNBC coverage on this potential money making trade.

QUICK SNAPS


Markets are trying an about face as SMH turns green on the heels of the AAPL battery recall (lol). Truth be told, I have no clue why the markets may be turning, but all that matters is whats on the screens.

Internals have rebounded to 400 red from the earlier 1,200 and sectors showing green include semis, nattie gas, oils and drugs; brokers airlines and retailers still solidly red and a rebound without the brokers/GS is probably not going to hold and those charts say no unless its a complete 180.

The IWM, pictured above looks interesting as a long from lower prices or a short higher as it seems to be held in tightly by 67 on the bottom and the 90 day SMA (71) on the top.

NOON UPDATE


The markets have broken lower on the heels of poor economic news and what Bob Pisani describes as a lack of buyers. Not sure about the latter but lower prices are in fact lower prices regardless of whether its cause is motivated sellers or unmotivated buyers.

Market internals have flipped to the red and now show about 1,250 more losers than winners with the only gaining sectors being oils and drugs. Losers are all the rest with airlines, retailers and internets doing the worst.

Areas where we might see some support are 129.15 on the SPY (pivot support level) and 37.75 on the QQQQ, the gap fill area from mid month.

A key tell lately has been the lousy performance of the IWM and if that continues, I suspect we have much lower prices in front of us.

SLOW GO


Markets are off to an uninspiring start as they trade near where they closed yesterday.

Best performing sectors include metals, drugs, bios and tech; biggest losers are homies, internets and retailers. Oils financials and GS trade flat, also offering no help.

The most bullish indicator on my screen is the internals as they show about 1,100 more winners than losers.

The most bearish indicator on my screen is the lack of upside movement in the small caps and the semis.

It looks to be one of those days where the gym may be the best alternative.

PRE MARKET CHARTS


Checking the NAZ 100 chart a few things to ponder; one, a gap remains at the 1535 area which will probably be filled only question is when; a bust through the 90 day SMA at 1575 also seems likely as it has been repelled a few time already and the more times it hits the more likely that it will make it past.

So depending on your directional thoughts a long with a stop just under the gap may make sense as would a short with a stop a bit above the 90 day SMA.

8.23.2006

CLOSING THOUGHTS


FWIW, if anything, the SMH outperformed the QQQQ and just about all major market indexes on a relative basis and the SEMI's should lead the market higher when it does decide to head up.

My guess is today was a bit of an overeaction to the homie numbers and the Iran news, so I expect a bounce back tomorrow although the gap on the QQQQ to the 37.75 is still on my radar.

The 129.30 level on the SPY has held and that corresponds well with the 1290 number on the SPX and the anticipated level of support.

Unfortunately, the VIX/VXO tandem continues to trade under their 10 day SMA's as most appear to be of the opinion that volatility will not be a key word until ALD or after Labor Day.

And why does CNBC care so much about Frank Quattrone, is this helpful to a trader/investor or anyone trying to make money watching these "journalists" all day?

MORE NUMBERS


One thing the Iranian/Homie situation is doing is helping to alleviate the overbought condition of the markets and perhaps show us where support may lines may be.

For those looking to buy this dip, the 2 day RSI of some major market ETF's are now as follows:

SPY-15

QQQQ-13

IWM-15

SMH-16

Generally, buy signals kick in when the levels hit 10 or below, so getting close.

Volatility indexes not helping with buy signals as they continue to stay low in light of the slow summer duldrums and the anticipation of the Labor day holiday.

Usually, I like to buy when the signals align and that doesn't seem to be in the cards any time soon as the VIX/VXO tandem are just too low and refuse to budge.

Also, keep in the back of your mind that there is a gap to fill at QQQQ 37.75 or NDX 1535.

IRAN UPDATE


So much for fundamental equity analysis as the markets fall on the news of a "nuclear breakthrough" by the Ahmadinejad and the Iranians. According to MEHR, the breakthrough will confirm Iranian status as a "nuclear country." I questioned a few times over the past several days when would "Iran" be back on the trading radar, however, I did not expect this kind of news.

Not sure what it all means, but I can say that the markets don't like it as they have gone straight down since the news was released at around 10:30.

Market internals have flipped to 2,300 more losers than winners and not surprisingly, just about all sectors are red. The worst of the groups are homies, oils, internets, retailers, biotechs, small caps and techs. Financials have also turned south but not quite as bad as most other sectors.

The SPX area of support looks to be the 1285/1290 level and the support on the daily pivot is at 129.3 on the SPY and 1290 on the SPX.

OPENING SEMIS


I guess the NSM guidance was good news as the SMH is up over 1% and NSM is higher by 2%, so its all in the eye of the beholder.

Anyhow, I was gonna say that the SMH was looking good on the pullback but so much for lower prices.

Market internals are very strong again with about 800 more winning issues than losers and sector winners are metals, SOX, AAPL, EBAY, internets, and airlines; losers include oils, GOOG and retailers. Brokers, banks and GS are flat so no directional help from the financials.

Homie numbers are lousy and that number is putting a bit of a damper on the rally; although I expect this dip to be bought.

The oil report is due at 10:30 eastern so be ready for volatility in the OIH/XLE group.

NUMBERS UPDATE


The numbers on the VXO/SPX are giving predominantly sell signals with the major one coming from the VXO being more than 10% under its 10 day moving average. In addition, the 5 day RSI of the VXO is way under 30, the general sell signal, at a low 15.

The SPX chart is also in sell mode with resistance just overhead at 1300/1305 even though the 2 day RSI is only a bit overbought short term at 62. The MACD Histogram and stochastics are quite toppy also giving a signal that we are toppy.

Today, the chart to watch is probably the SOX/SMH as the reaction to the NSM guidedown will be key. The NAZ and the SOX indexes have bounced nicely off their lows but now everyone will want to see the reaction to the bad news.

8.22.2006

THE CLOSE


Markets close near the unchanged line and bounce off their mid day lows and ignore the hawkish fed speak. This action is bullish in my view especially in light of the IWM, the best acting major market index of the day.

Internets and AAPL also acting bullish as they were the best performing sectors of the day along with homies, nat gas, oils, drugs, some tech and bio. Worst sectors were retail KLAC and DNA with the SMH selling off in the after markets.

Market internals also closed well with 850 more winning issues than losers.

Some of my long term holds including XTO VLO FTO XLE all acting well on the heels of new hurricane Debbie. I guess in hurricane season we are due to get at least one storm.

FEDSPEAK


The markets have done an about face and drifted lower on the heels of a hawkish fed speak.

It is interesting that homies, techs, AAPL EBAY YHOO have stayed green despite the selloff. Losers are semis, metals, biotechs and consumers.

Market internals have also flipped to flat while the 10 year Bond still trades at the 4.81% area so fed speak not impacting the fixed income gang.

I still think we will get a lift before the day is out as this may be the pause that refreshes.

Depressed Red Sox fans can take some solace in the fact that they may not be the best team in the A.L. east, but they do have the best video clip of the week brought to you by NESN.

DOLDRUMS RECAP


Since we are smack in the middle of the lazy summer days I thought it time to check the performance of some of the major market indexes/stocks since the year began.

Interesting how the big integrated oils have outperformed the oil service companies and how bout the semis, any chance of a bounce?

The best performance comes from SSRI (+52%), a silver stock that has been mentioned numerous times on this site. Here are some others:

QQQQ-4%
IWM+6%
SPX+4%
DIA+6%
SMH-10%
HHH-26%
IBB-7%
DRG+7%
VLO+22%
XBD+10%

GOOG-9%
MSFT-.5%
INTC-27%
XLE+15%
OIH+9%

I think this gives some pretty interesting ideas for "reversion to the mean" trades.

DOLDRUMS


Not sure if I am watching grass grow or paint dry but the markets are back trading in the summer doldrums of August with out much movement.

I susupect a slow drift up today as a bid seems to be underneath the market and I am playing long via EMINI futures.

Market internals continue to improve and now show about 1,400 more winners than losers.

Sector brightspots include internets, airlines, homies, techs, brokers and trannies; losers include metals, retail, GOOG and DNA. Oils are trading flat on the heels of the news out of Iran.

GOOD VIEWING


Markets open a bit higher on strength in internets, semis, MSFT, trannies, airlines and brokers with weakness in metals, homies and drugs.

Market internals are slightly bullish with about 700 more issues trading higher than lower.

I purchased some MSFT yesterday and plan on scaling into more on weakness as the chart looks good and all the bad news seems baked in the cake.

Final note, check out this video that someone sent me. Interesting viewing.

8.21.2006

SAY GOODNITE


Not much to be said about the markets this afternoon except BORING. A very light volume day as one would expect for late August and probably the same for the rest of the week.

Best sectors today were metals, oils and reits with the worst being internets, trannies, homies and airlines.

Market internals closed with about 1,500 more losers than winners but improving all day.

Volatility indexes went nowhere as the VXO got to 11.06 and the VIX to 12.29 and I suspect most are not expecting much of a ramp in volatility any time soon as the QQQQ range was 30 cents and the SPY range was 45 cents. These are the dog days of summer as the indexes closed at about the same place they opened.

NOON LOOK


Markets continue to trade lower with the worst indexes being small caps, SMH and QQQQ.

Internals continue a bearish tilt with over 2,000 more losers than winners with big sector losers being airlines, semis, techs, internets, homies and trannies. Metals and oils are higher although off their best levels.

I was doing a bit of web surfing this morning and found this interesting commentary from Kevin Haggerty at TradingMarkets.com:

"The SPX matched its best week of the year (1/6/06) at +2.9%, bouncing off its 1262.08 low (200-day EMA) on 8/11/06. It was also a key time zone in addition to option expiration. The short-term internals are now very overbought, with the 4 MA's of the volume ratio and breadth at 71 and +1190, with the SPX 5 RSI at 83.65. This is obviously a situation where the "Casino" holds a major edge should you be a buyer. In addition to the internals, last week's average NYSE volume was the lowest since March, with the exception of the two holiday weeks. Rising prices on declining volume is always a red alert. NYSE new highs peaked at 139 on Wednesday and declined the last two days to 115.89, which is also a minor negative divergence. There was significant short covering last week in many technology stocks, especially the semis, with the SMH +8.0% for the week, in addition to the $TRAN, +6.0%. The $COMP closed at 2164, just below its 200-233 day EMA resistance zone at 1274 - 1277. The QQQQ weekly chart was included in the previous commentary and outlined the significant resistance at 40 - 43."

Kevin is a former bigwig at Fidelity and has posted terrific columns in the past at TM and I recommend him highly.

CRAMER TALK


If you think Jimmy has fun predicting the year end DJIA numbers, check out his latest short term forecast:

"Don't lose heart in this rally, but get ready to do some selling. After an up expiration week, the tendency is to trade down for Monday and midday Tuesday before a challenge upward. I suspect this is no different.

I suspect that this pattern will be exacerbated by the Lowe's (LOW) note about a slowdown and the Toll Brothers (TOL) number today.

But when we clear those numbers we should get another challenge higher with a retest of the oil declines and the prospects of another uplift in tech, because the bulls sense a bear rout in the group.

That will give people a chance to trim, because last week was an aberration with a lift in the cyclicals and a tiny decline, ex-Altria (MO) , in the staples.

I suspect the selloff will be concentrated in the cyclicals that can't be taken over.

I would sell into the overall rally that I expect Wednesday and Thursday, and be ready for a decline into next week."

How can he write this drivel?

OPENING LOOK


Looks like Iran is back on the radar as the market opens lower with losing stocks beating out winners by about 1,800 issues.

The biggest major market index loser is the NAZ 100 with the QQQQ trading down almost 1%.
Sector winners are the usual suspects, oil and gold with GOOG, GS, retailers, airlines, techs, internets and trannies leading to the downside.

I assume the short term trading tell will be the dippers and how soon before they come in and buy and stabilize the market; on the flip side, how long the folks with the big profits want to sit and let those profits fizzle away.

The fear/complacency indexes VIX/VXO/VXN are up big this morning so at least the option buyers are happy.

Watch the internals, SMH, GS, the financials and IWM for the hint of which the direction will be.

8.20.2006

MORNING STUFF

Above, a three year weekly chart of crude. Lots of folks now with the $50 oil right around the corner theory, from the looks of the chart, seems to look just fine for a continuing uptrend.

Dr. Brett, on his site this morning with a great statistical analysis of buying strength and selling weakness. Bottom line, it doesn't work very well.

Here are the latest Random Links from Captain Kirk.

More randoms from Adam and how bout that Red Sox pitching crew, and folks thought the Yanks had mediocre pitching.

And when does Iran and Ahmadinejad get back on the Wall Street radar?