7.29.2006

TECHNICALS-SPY


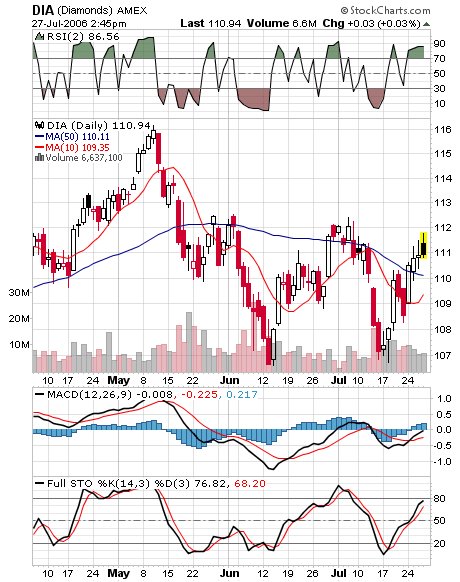
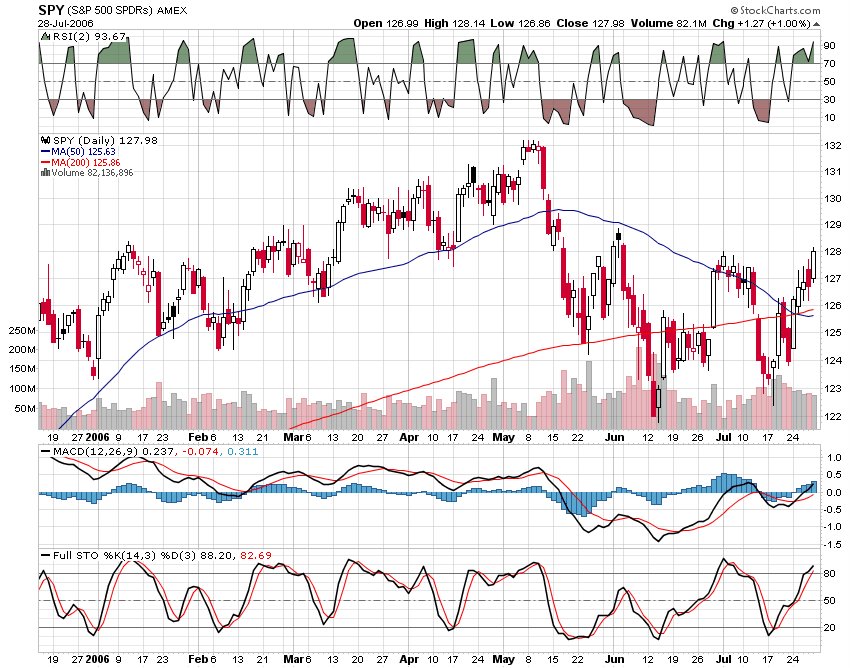
Checking the numbers on the SPY, the ETF is in overbought territory, 2 day RSI of 94 and both MACD and FULL Stochastics giving overbought readings.

The obvious area of resistance is SPY 128 (current quote) and the high from early July; with the next resistance level being 129, the high from early June.

The 50 day and the 200 day SMA's of the SPY are both upward sloping (barely) and below the current quote, and the 50 is below the 200. So some obvious overbought signals, but it still may have some room to run with the seasonally strong next few days and the new trend up.

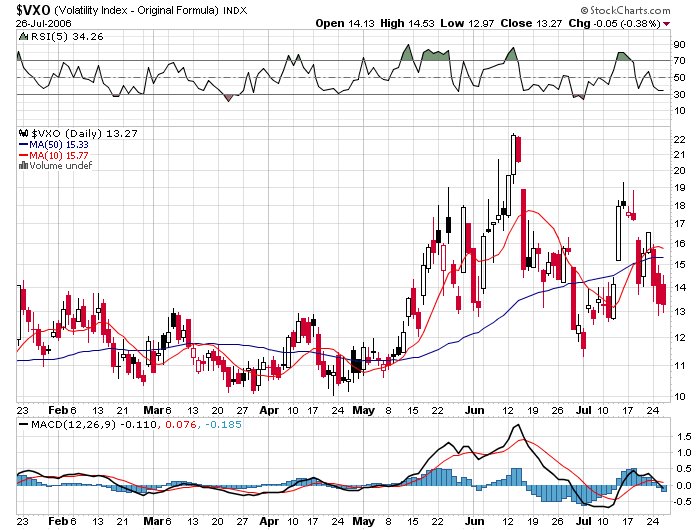
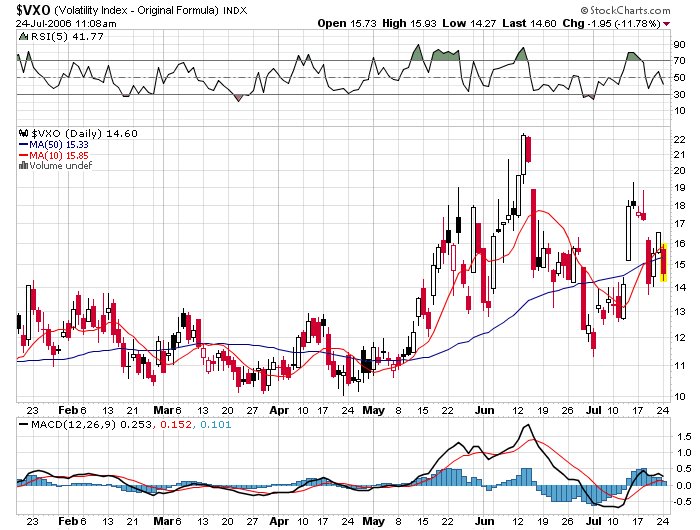
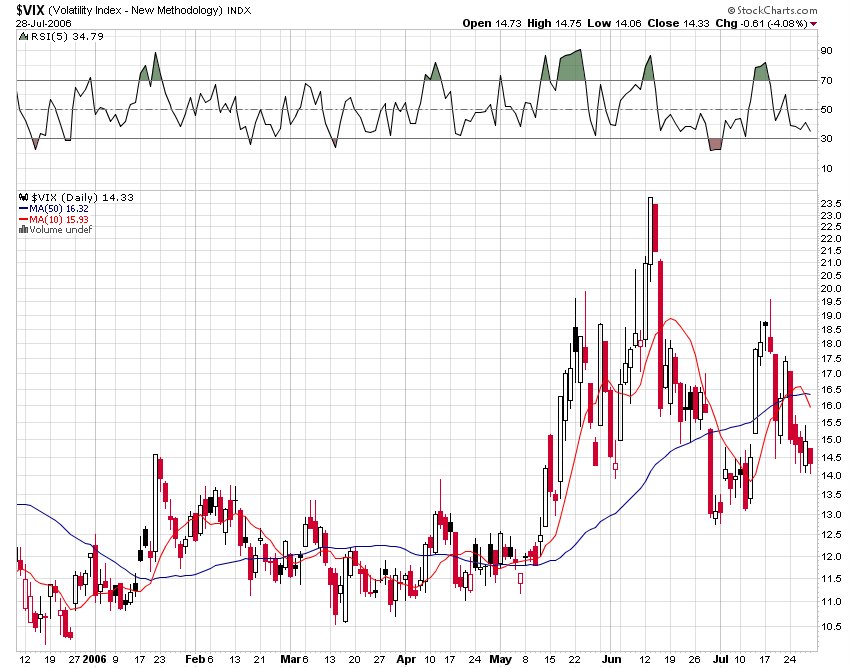
VIX also giving the same overbought SPY signal as it trades at 14.33 and 10% below its 10 day SMA. If you take a close look at the chart, it is apparent that the VIX has traded in a range between 13 and 19, so selling at 14.3 is probably not a terrible idea; if you didn't sell, monitor the price closely with tight stops.

Another sell signal developed by Larry Connors from TradingMarkets.com is the reading of the 5 period RSI of the VIX. According to Larry, when the number is under 30, its a good time to sell and the current reading is 35, so close but not yet.

WEEKEND LINKS


Just in case you missed them, here are some terrific links from Captain Kirk, Barry R, Adam W, Abnormal Returns, and check the latest from Dr. Brett on smooth V choppy.

And when will Michele win one, just one.

7.28.2006

BIG GAINS


Lots of headlines and chatter about this being the best week for the SP500 index since March 2003 and we all know what happened then (beginning of bull mkt).

For those who like to buy the top of ranges and break outs, I direct you to this post back in March about buying highs and shorting lows.

Bottom line, your better off buying 10 day lows and selling 10 day highs.

Today's action finds strong internals (+3,000), metals, brokers, semis, airlines, banks and techs. Weak sectors include oils, drugs and consumer stocks(relative underperformers).

Most of my index longs now sold but waiting to put out more shorts as the first few days of the month tend to be strong as new 401k money and other savings finds its way to mutual funds.

And should we have suspected something was up when Floyd just made "the best ride ever" at the Tour de France according to Trautwig, Sherwin and Liggett.

NOON UPDATE


The bull is having his way on the news of lousy GDP numbers, the hope of lower rates, and I suspect marker upperers having some fun on the day before the last day of the month. My question, where were the bulls yesterday afternoon when I wanted them?

Market internals remain very strong with 3,000 more winners than losers and winning sectors are all over the spectrum as semis(+2.5%), banks, metals, brokers, small caps, retailers, techs and trannies all participate. The oils are having a rough go in light of lousy numbers coming from CVX and lower crude.

Technically, the SPY and the DIA are both in overbought territory on a short term basis with respective 2 day RSI readings of 93 and 97. VIX/VXO combo both trading at 90% of 10 day SMA- equals more sell signals. The QQQQ continues to lag with a 2 day RSI reading of 79 while SMH has been getting a bid; 2 day RSI reading of 96.

OPENING LOOK


Markets open higher as yesterday afternoon's selloff is quickly put in the rear view mirror. Not sure what happened but the markets gained much of the pre 4:00 selloff back immediately after the close. Maybe some end of the month shenanigans in light of what is happening this morning.

Market internals are uber bullish with 3,000 more winners than losers with best performing sectors being metals, semis, small caps, retailers, brokers, airlines and biotechs. Oils are flat and the volatility indexes are getting wacked down 3/6%. The 10 year Bond should be watched as it sinks below the 5% level, so maybe the thought is stocks are cheaper as interest rates fall.

TECHNICALS-SPX

Checking the technicals on the SPX, the index is trading a hair above its down sloping 50 day SMA and a hair below its upward sloping 200 day SMA. Stochastics and MACD look a bit overbought and the 2 day RSI sits at 44. Its also trading at the high end of its 1220/1280 recent trading range. Note that the DJIA has been stronger than the SPX as it trades above both its 50 and 200 day SMA's. Bottom line, not much of an edge either way except for the last few days of the month and first few days of the month generally being a bullish period.

Economic numbers of the day come in rate friendly as the GDP number is +2.5 vs expectations of +3, so the thinking of the moment is rates will not be raised in August. The current rate on the 10 year Bond is 5.00 as it has fallen from 5.035 before the release. So for the moment bad is good; but it could all change on Monday.

Fair value is way below where futures are trading in light of the post 4:00 bounce back yesterday. My game plan should probably be to go to the gym as there doesn't look to be much of an edge on a swing trade.

7.27.2006

DUMB


The negative tells for the long DIA trade were:

1) lousy naz internals

2) poor action in the IWM

3) oversold levels in the VIX/VXO indexes

4) oils hitting their highs on the open and retreating all day

5) poor action in the biotechs

6) overbought 2 day RSI levels on the SPY/DIA

The positive tells:

1) positive action in the semis

2) positive NYSE internals (then)

DIA could still ramp into the end of the day, but that doesn't make it a good trade. It should never have been entered.

AFTERNOON TAKE


There are lots of mixed signals in the markets today as the "imminent release of the prisoner rally" hasn't panned out as bulls expected. Markets are modestly higher with the big guy (DIA) outperforming the other major market indexes.

Naz lags while SMH acts well (+2%) with NAZ internals "iffy" at +225. NYSE internals are much better with 850 more winner than losers.

Sectors outperforming include the aforementioned Semis, brokers, techs and metals. Bringing up the rear are biotechs, GOOG, drugs, trannies and homies.

My strategy has been buying the dips in DIA as the 23/7 a/d line looks bullish for the daytraders. Tight stops also the order of the day volatility may unexpectedly expand.

CAUTION

Markets are trying to rally on the news from Palestinian President Abbas that the Israeli prisoner may be freed imminently. Not sure how Hezbollah will react, but it certaintly needs to be watched.

My take, watch the NAZ internals as they sit at +275 as the futures rally. That is not bullish and with the oils selling off on bullish natty gas info, I would be cautious about buying.

In addition IWM is lagging the major indexes so more not so bullish news.

THE OPEN


Markets open higher led by semis(+2%), brokers, metals, small caps and tech. Conspicuously missing are the oils, which have gone straight down since popping at the open. Also acting poorly are biotechs, drugs, homies and trannies.

Market internals show 2,000 more winners than losers after opening with 3k more winners, so a heads up as they have weakened through the opening 1/2 hour.

Winning DJIA components include CAT INTC IBM and UTX while laggards include DD GM HD and BA as 24 are higher and 6 lower.

Lousy home sale numbers hitting the tape as I type, but who expected different.

I am watching for a gap fill and will probably buy for a quick rental if we get close.

MORNING GAP


The markets are set to gap up and according to the book, a gap fill is a high probability (82%) on Thursdays.

The Pivot Point today is 126.8 on the SPY and first resistance is 127.5, so watch those areas for clues of direction along with internals and the greatest tell of all of late, the oils.

The violence in the Middle East and Iraq seems to be getting worse but the markets and media seem to be putting it on the back burner. Just wondering if there is something that may put it on the front page? And is Condi in trouble?

7.26.2006

THE CLOSE


One of those day where if you didn't like the price on the screen, wait, it will get to one more amenable. After all the gyrations, the markets close about where they opened with the Oils being the shining light as the XOI made a new all time high and briefly pierced the 1,200 level.

Biotechs, metals, drugs the best performing groups with internets, trannies, airlines are retailers bringing up the rear.

The markets remain overbought on a short term basis and the Volatility sisters continue their oversold ways with the VIX/VXO combo still trading about 15% under their 10 day SMA's, so more churn or lower prices is probably the most likely short term direction.

SIGNAL UPDATE


The market internals have again flipped to green with 650 more winners than losers and the oil stocks are ripping higher. The major indexes are higher but every rally today seems to be sold and every dip bought so I thought it a good time to review some buy and sell signals.

The Volatility VIX/VXO sisters are giving sell signals as they are oversold and trading at about 15% below their 10 day SMA's. A sell signals generally appears when they sink to 10% below, so a strong sell signal there.

The SPX is sitting just above its 50 day SMA and nearing some resistance at the 1275/1280 area. The 2 day RSI sits at 85 and the sell signal is generally a reading of 90, so maybe a bit more to go.

IWM is sitting a bit below the 50 day SMA with a 2 day RSI of 79 and overhead resistance sitting at the 71+ area. Again, a rally higher to resistance would not be surprising.

QQQQ, tech heavy and home to most of the earnings blowups, is the worst performing of the major indexes, and it sits below all resistance and is way below its 50 day SMA at 38. The 2 day RSI reading is 80, so again, maybe some more to go.

TECHNICALS -SMH

Lots of folks have been trying to bottom fish the SMH and so far to no avail, but I wonder if now may be a good time as the 2004 and 2005 bottom areas have been hit. Seems like a high probability trade with a logical stop in the 28 area with a target of 35.

NOON LOOK


Markets open weak but seem to want to rally as the market internals continue to improve. The oils continue to lead with biotechs and semis strong; bottom performing sectors include internets, trannies, airlines and retail.

I have gone long some SPY but will watch closely as I don't usually like to buy when they are this overbought. Also covered some of the QQQQ trade as the market feels like it wants to go higher despite the short term overbought condition.

I was also curious about Bill Millers's AMZN holdings and it looks like it is number 5. Also in the top 25 holding are EXPE, EBAY and YHOO. It is going to be tough to outperform with those in the top group and he is now down 7% on the year.

One of the stocks I wanted to mention yesterday was XTO. This has been a great stock over the past few years and it has consolidated over the past few months. They reported good numbers/guidance yesterday and my guess is that if oil hits the century mark as per Boone, XTO will be a major participant.

GONE BIKING BACK IN A BIT

7.25.2006

FLEECED?

The markets closed a bit off their highs but the after market is looking none too good as AMZN blows up again and is trading down 10% from the close. My QQQQ short is also being impacted, trading in the 36.43 area up .02 cents on the day; so the short entry and the long exits are looking good for now. QQQQ also looks to be the major market index acting the worst, so if you are looking for a short, that may be the ticket.

SPX and the IWM have also given back much of the days gains so the bulls may not be out of the woods yet as we may find ourselves back under major resistance areas again tomorrow (1260/1265).

STOP TRADING

I was just going to put up a post about how I didn't have to get out of bed but all of a sudden the markets get some juice and are now higher. SPX 1260/1265 is now in the rear view mirror as my bullish pals keep pinging. I just wonder if the bulls realize that the market is being led by oils and metals (the good old days). Biotechs also acting well with the homies and semis; trannies, internets and GOOG lagging.

VIX/VXO combo down another 3 to 5%, so those indexes are going from oversold to very oversold at 15% under the 10 day SMA and the 2 day RSI on the SPY 86, so more sell signals. My strategy, sell more longs while I scale into more QQQQ short.

$1,500 GOLD

Markets look like they are trying to mount a comeback as the internals flip green again and show 500 more winners than losers. Small caps look like the place to be as they are green and outperforming all the major indexes. Oils, biotechs and metals now leading the way with internets, trannies, GOOG and Indian equities bringing up the rear.

Howard Rosencrans on CNBC calling for $1,500 gold and lower stocks prices with a nice chart of cash levels at mutuals funds and what a good predictor it may be of future stock prices.

I am not sure I agree with the gold call but $1,000 sounds good enough as I own lots of precious metal equities. Unfortunately, Howard did not give us a when for his forecast, so maybe Sue can get him back and get a time frame(lol).

MONKEY MARKETS

The markets are making monkeys of most traders as a lower open, a rip higher on some 10:00 economic news and a fall back lower on pictures of lots of smoke in Beirut as it appears that Nasrallah may be back in the sights of the IDF. Not sure if that is the reason for the selloff but my guess is yes, of course in conjunction with the oversold volatility indexes, overbought short term market conditions, 1260/1265 resistance on the SPX and the UPS guidance.

Market internals opened red, flipped to 2K green and now back to flat. Possible tells for the day include the selloff in oil stocks after the initial rip (bearish), brokers (bearish) and tech now flipping to red (bearish).

OPENING NOTES

Problems with blogger at clogspot not allowing pictures, but many can guess what picture went with the prior post.

Anyhow, the markets have opened lower due to oversold readings on the volatility indexes, Boone calling for $100 oil, a big miss on guidance by UPS or something else. Glad to hear that Susan Byrne loves the market as do most long only mutual fund managers. They always love the market.

Market internals show about 400 more losers than winners with best performing sectors being oils, metals, semis and biotechs. Worst groups are trannies(UPS), GOOG, brokers, airlines and retailers.

Back to Boone, in the interview where he called for $100 oil, he mentioned that supply and demand were at or near equilibrium levels of about 83,000,000 barrels a day. His concern is what happens when/if some of the supply goes off line.

MORNING AMUSEMENT

In light of the one year anniversary (approximate) of the tracking site of Jimmy Cramer's mad money performance, I thought it appropriate to do a little homework and see exactly how Jimmy has fared. According to the site, Jimmy's performance is +2.9% which does not include commissions (892 stocks purchased) or slippage but does include a boost from the difference between the 4:00 close and the typical after market recommendation gap up. There is not much question that if you factor in those three items, the returns for the year would be negative.

An alternative investment, would have been the SPY, which closed on July 28 at 123.9 and closed yesterday at 126.21. In addition, one would have collected a dividend of $2.27 from the quarterly dividends for a total simple return of 3.7%.

Bottom line, no matter how good or bad you are, if you recommend 892 stocks over a twelve month period, you will not beat the market because of the simple reason that you are the market and once commissions and slippage are factored, one has no chance.

Bottom line, turn the TV's off when the rooster shows and STOP LISTENING. There is no edge to following his selections.

7.24.2006

TECHNICALS -QQQQ

The markets end the day as I suspected, near the highs with market internals very strong as there were 3,500 more winners than losers. The best sectors today were oils, internets, homies, trannies and biotechs with the banks and consumers lagging but still higher.

Dave Landry at tradingmarkets.com calls himself a trend following moron because he likes to trade pullups and pullbacks into the prevailing trend. The trend of the QQQQ is hard to miss and with today's pullup shorting seems to be the high probability trade. Note that today's high is lower than last Wednesdays high and the pattern of lower highs and lower lows dominates the chart. The bounce in the semis today also seems subpar so another feather in the cap of those wanting to short the tech/semi heavy NAZ.

MARKET RIDDLES


The markets continue to trade near their highs despite oil trading back over $75 and disappointing news from the Middle East where a cease fire is still not on the table. Leading sectors are oils, internets, natty gas, small caps, biotechs and homies. Not many sectors are more oversold than the semis and today's bounce has to be a bit disappointing to the bulls leading me to believe that QQQQ/tech will continue to be a weak sector.

So why are the markets ripping higher; my guess oversold conditions/M and A activity and good news from the drug sector.

The money trade has been a fade of rallies and that is exactly what I plan to do via the QQQQ. The VXO/VIX combo are both in the oversold area and approaching, or at, the "magic" 10% below 10 day SMA level.

Remember, markets that are strong all day tend to close at or near their highs and I don't expect today will be different and that is why I intend to wait a bit for the QQQQ short entry.

HOW LONG?


The markets rip higher this morning getting right back to the oversold area of 14.5 on VXO which is 8% below the 10 day SMA and nearing the important 10% below level. The SPX presently sits at 1256, or about 3 points under the 50 day SMA and the 2 day RSI of the SPX has now ramped up to a 72 reading. So maybe a little further to go but keep in mind that we are in an ugly downtrend. If your not sure of the trend, pull up a chart of the QQQQ that will end all doubt.

Keep in mind that it was just last Wednesday that the markets rallied right up to the 50 day line. The NAZ and the QQQQ immediately sold off to new lows and the question by every trader is will it happen again. The general rule remains, trade the overall trend and short pullups to resistance areas.

BOUNCEBACK


The markets are higher either on hopes of peace, lower oil prices, M&A, end of fed rate hikes or something else like an oversold market.

Anyhow, there are more than 3,000 more winners than losers with top performing sectors being airlines, Indian stocks, biotechs, small caps, retailers, brokers and oils. Precious metals the one sector lower.

For all those waiting for the outperformance of Big stocks over Small stocks, I direct you to IWM+1.8%, SPY/DIA+.8%, and note the outperformance of big over small seems to only occur on down days.

GOOG is also lower and interestingly, QQQQ and SMH are both underperforming the SPY/DIA.

My take is any move back to the SPX 1260 area is the area to sell/short.

FOOD FOR THOUGHT


Dr. Brett S on his Trader Feed site has some interesting factoids this morning about the AAII sentiment numbers. In light of the latest 58% bears and only 24% bulls reading, he says we have one of the most bearish readings since 1989. He notes that when bears exceeded bulls my more than 20%, the next 10 weeks in the DJIA have averaged a gain of 4.48% (37 up 9 down). The typical 10 week gain for the DJIA is 1.93% for his entire sample period. When bulls exceed bears by 30% or more, the next 10 weeks in the DJIA have been up an average of .83% which is less than half the average return for his sample.

Bottom line from Dr. Brett,

"Down markets followed by extreme bearish sentiment have tended to be bullish in the intermediate-term; up markets followed by strongly bullish sentiment have tended to yield subnormal returns in the next two months. Occasions in which we've had more than 50% bears have tended to be either major cyclical bottoms or intermediate-term low points during bear markets that have preceded sharp rallies."

The Doc cautions that the sample sizes are small given the clustering of bearish readings at certain points in time.

My take, follow the Alex Elder strategy and pick your spots to short pullups in this strongly downtrending market.

7.23.2006

PORTFOLIO HITS


If you have taken a clobbering in the markets, its not only you. Check out some of these highflying IBD 100 stocks:

IBD Rank 2 HANS 18% off High

IBD Rank 5 NEU 29% off High

IBD Rank 7 CRS 28% off High

IBD Rank 12 WIRE 31% off High

IBD Rank 30 HITT 25% off High

IBD Rank 31 GLG 24% off High

IBD Rank 41 TTI 23% off High

IBD Rank 44 FORM 21% off High

IBD Rank 75 WCC 28% off High

Also interesting to note that two energy royalty trusts have now hit the list, PWE and BPT. And if you think the names above have done poorly, just think how some stocks that have been dropped from the list have fared. All part of the momentum game.

MORE BARRON'S


More stuff from Barron's like an answer to one important question:

Why have price earnings multiples around the world skidded?

Answer:

Higher interest rates, inflation fears and last but not least imvho earnings concerns.

According to Byron Wien, now from Pequot, "growth is hard to come by in the U.S., Europe and Japan, and the markets are also being held back by the fact that investors sense that we're in a more uncertain environment caused by an erosion of economic power in the U.S., a migration of scientific innovation to other countries and terrorism. The Iraq war might have made U.S. stocks appear to be riskier than they once seemed and thus made investors unwilling to pay as much for them as they would if peace prevailed."

Wien apparently went out on a limb at the beginning of the year according to barron's by predicting the SP 500 would drop to 1200. Not sure why that is a risky bet as the year started at 1248, a whopping 4% drop to get to the target branch.

My take, prices have come down and will probably come down further due to geopolitical tensions, higher rates, SLOWING EARNINGS GROWTH and the new Fed head.

Last question; how much of the earnings growth is due to the record earnings at the oil/ oil service companies. If the earnings growth of those companies were removed the overall earnings growth of the SP500 would be?