3.11.2006

WEEKEND RANDOM LINKS

Another take on the Housing Boom or Bust.

A Look at Bear Markets from the Journal of Financial Planning.

A Kewl list from Forbes.

Check out these LEGO Creations.

If you are Bearish, you may want to check out this site.

If you are Bullish, you may want to check out this site.

What did this guys background check show?

Bush to EXPLAIN WAR STRATEGY!!!

Michael Jackson back in the News.

Michael Covel on Trend Following.

What's happening with Lobbying Reform?

Latin workers number 5% of total.

Food stocks the next Momentum craze?


The Birds are coming, the Birds are coming!!!

It will not be long now!!!

3.10.2006

KEWL RANDOMS

THE CLOSE

The markets closed near their highs of the day but not at their highs (lol). The QQQQ and the SMH were very conspicuous on the list of underperformers along with GS. The BIOS along with the former highflyers SNDK BRCM and MRVL all closed in the red as the theme of the day was S's over N's. The VIX sunk 6% on the day probably signifying the end of this little rally. Lately, every time there is a bit of a rally the VIX sinks and the rally stalls. I do not have a great feeling about stocks making significant gains in the coming weeks.

ANOTHER REQUEST IYK

The chart above is the IYK, the ETF for the consumer goods sector. The major components are PG MO PEP KO BUD and CP. I would call this the ETF to own if economic activity slows due to higher oil prices, higher interest rates, plunging housing prices or anything else one can imagine. The stocks have been outperforming lately and they may be a good place to hide. Recently, technology stocks have been under pressure as one can clearly see by the action in the QQQQ and SMH ETF's, and the action in some recent favorites such as MRVL BRCM AAPL GOOG and just about any other high flyer.

This chart has the characteristics of higher highs and may be a good acquisition on a pullback to the 53.75 area. This ETF will not be a home run, but it may keep you out of trouble.

2:00 LOOK

I just like the picture and the three stooges, thats why. The markets are hanging in with the DJIA and SP 500 leading the way. Just about all sectors are higher but I note that Goldie (GS) is red on the day. The other financials are doing just fine so I am not sure why it is lagging. The Nazdog is definitely lagging with the QQQQ up a whole 15 cents and the SMH not getting near the jig one would expect on a day like this. The DJIA is up 90 and the SP 500 is +9.6. and the internals hold in at +2,200. On days like this they usually close em at the highs but today I don't think that will be the case.

NOON LOOK


CONFUSED, well this guy above doesn't look confused. The internals have flipped to +2400 and all major sectors have flipped to the upside. There were some very high TICK readings when the market started ripping higher. One reason I am hearing for the spike is very oversold conditions on the hourly charts. Could be. The 10 year Bond rate is up a bit less than 1% at 4.769%. The equity markets usually do not like higher rates because of the competition from the bond markets and the higher borrowing costs for corporations. Makes the morning rally sellable in my opinion. The fly in the ointment? THE VIX. It is now lower by almost 7% and under its 10 day SMA. I would not be chasing the stocks here. Just read the recent post on buying equities when the VIX is above or below its 10 day SMA.

CONFUSED


A bit confusing this morning as the markets really are mixed. The Nazdog is down 7 the SP 500 is +2.5 and the internals are +335 on the NYSE but flat on the NAZ. In addition, the 10 year rate is about 1% higher up to 4.775%. The financials are mixed, the SEMIS are flat, OILS red, BIOS red, TECH MOMO is red and color me confused.

MORE FUN FACTS


The Connors Research Group, mentioned below, also did some work with the VIX. They looked at the period from 1990 (the first year calculations from the CBOE for the VIX) through 2003. They looked at the VIX as it stretched beyond its 10 day SIMPLE MOVING AVERAGE. The findings were as follows:

"The futher the VIX rises above its 10 day SMA, the greater the liklihood that the market will move higher and the greater the liklihood that the market reversal to the upside will be greater than the average daily move of a normal market. In fact, the one week gain in the SPX when the VIX is 10% above its 10 day SMA is more than double the average weekly gain over the 14 year period.

During the test period, when the VIX has closed 10% or more above its 10 day SMA, the average one week performance of the SPX is in excess of .6%. The average one week performance of the SPX when the VIX closes 10% or more below its 10 day SMA is about zero. When the VIX is stretched 15% above the 10 day SMA, the average weekly returns are in excess of .8% and when stretched 15% or more below the 10 day SMA, the average weekly return is negative. Cody, are you listening?

3.09.2006

JUST THE FACTS

In light of Revshark's comment earlier today, I went back to my library and researched information from a book called How Markets Really Work written by Larry Connors (founder of TradingMarkets.com) and Conor Sen of the Connors Research Group. The authors analyzed certain market data from 1989 thru 2003. Some of their very telling results are summarized below and I quote from it:

"First we looked at the SP 500 from 1-1-1989 through 12-31-03. We then looked at how the SPX performed every day during that period of time. We found that the SPX had gained an average of .04% per day and an average of .19% per week for the 15 year period, reflecting the bull market move.

We then looked at the average daily gain of the SPX after it made a new 5-day (intraday) high. Remember, new highs are supposedly a sign of strength, are "breakouts," and are considered by many a time to buy. What we found was the opposite. These new highs underperformed the average daily market. Their average daily gain for the next day was half coming in at .02%. We also looked at how these "breakouts" did over the next week and again we see them underperforming poorly. In fact the average 1 week gain was .03%, far less than the average weekly gain of .19% over the same period.

Ten day new highs, which are considered even stronger markets to be buying, showed even worse results. Their average daily gain after the SPX made a new 10 day high was zero. The weekly results were just as poor, also showing no gain.

We then looked at when markets were acting poorly. We looked at the performance of the SPX after it made a new 5 day low. Again, our findings were completely at odds with conventional teachings. We found that the average daily gain after a 5 day low was .06%. The average weekly gain was .47%, outperforming the average week and far outperforming the week following a 5 day high. The 10 day new lows showed similar performance. The average daily gain following a 10 day new low was .12% and .56% for the weekly gain."

Very interesting information indeed and sheds further light into my strategy of buying lower and selling higher.

I will post more information and facts from this and other books in the future.

THE CLOSE


The close was not a pretty sight today and Larry Kudlow of TV fame is blaming the lousy day on the Dubai Port situation. Hard to believe Larry is going with the administration on this issue. Shocking. Back to the markets, they hit their highs on the day early in the session and sold off consistently through out the day. The internals were 1,000 to the red, and just about all market sectors were lower. The worst performance came from the Nazdaq and the techs in particular with the chips being especially weak. I guess we will have to wait a little longer for Cramer's tech rally which he consistently calls and never seems to come. Same old same old.

MORE CHARTS

I generally do not like to short individual stocks, however, my hedge fund buddies tell me that the fundamentals on this stock are deteriorating. Technically, the stock is probably a bit stretched and like a lot of charts I have looked at lately, the momentum indicators are leading the stocks down. This stock looks like it may meet up with the 38 area before too long and I shorted some this afternoon.

3:00 LOOK

The markets are drifting lower here as the initial gap open was sold and the internals quickly flipped into red dye. My take is that it is probably to late to short and to soon to buy. My game plan is now to wait until more signals line up. I am anticipating the Volatility Sisters will again become overbought on an additional market selloff.

Earlier this morning, Revshark on realmoney.com posted his opinion that buying strength was more profitable than buying weakness. I am planning a post to dispute Revsharks "buy strength" mantra. Here is what he said:

"One of the ironic things about stocks is that quite often the ones that are going up the fastest and are closest to their highest prices may indeed by the best "values." Stocks that are in the process of being discovered can go up substantially as the market begins to value them correctly. It depend where they are starting from. On the other hand, a stock that is down sharply from its high may look like a bargain but really just be in the process of being priced more correctly. If we expect it to bounce back, we will be disappointed.

The key is to not think about stocks like they are merchandise on the shelves of a store. Just because they are marked down doesn't mean they are a good deal, and just because they aren't on sale, doesn't mean they aren't a steal. "

MORE BEARISH DIVERGENCES

Here is a chart of the SMH, an ETF for semiconductor stocks. In January, the stock made new highs but the momentum indicators were lower than they were when the price was much lower in early December. The stock rolled over in the middle of January but the momentum indicators gave plenty of warning of what was to come.

SPECIAL REQUEST RTH

The RTH seems to be in an intermediate term downtrend. The lower low lower high action seems to be reemerging after a recent spike higher. The longer term action on the chart also indicates bearishness. The momentum indicators are also shouting that the near term price action looks lower. My best guess says back to the 94/95 area in the near term.

GROWLING


The bear seems to be growling and the small rally I anticipated has come and gone. The market internals have shrunk to a net 500 winners over losers. The major market sectors are flat, the NAZDOG has turned red and the SP 500 is back to even. The next blip up will be sold by me and shorted.

RANDOM LINKS

10:00 Look


The markets have opened with a slight gap higher and have been climbing. The market internals are as strong as they have been in days with 1800 shares net to the upside. Every sector looks higher sans the biotechs. I will be trying to flip 1/2 my recently purchased ETF's at about SPY 128.8 . That will be about half way between the top and bottom of the recent range. The range topped out at 130 and hit about 127.15 yesterday.

MORE TECHNICALS

Above is an updated chart of the SPY with a few more technical indiators. The charts indicates the markets are in a trading range but the indicators show that a top may be forming. The momentum indicators are turning south meaning the markets are running out of juice to keep the rally going. Momentum indicators tend to lead the markets as they show the rate of change in the increase in price. If the rate of change decreases the chances are the markets go lower.

The markets are set to open a tad higher in light of the rally overnight in the overseas markets and hopefully a carryover of yesterdays afternoon rally.

3.08.2006

ALL SHE WROTE


The markets rallied significantly off the lows of the day but did not make much progress. The SP 500 closes +2.6 after being down about 8 points at the lows of the day. The NAZDAQ closed -1 and the all important DJIA closed +25. The market internals closed with about 100 more red than green and most major market sectors closed unchanged. Bob Pisani on CNBC going on about the rally in stocks being attributed to "a rally" in the bond market. My data provider show the 10 year at unchanged. The Volatility Sisters closed a bit in the red but still overbought. Hopefully the rally will accelerate tomorrow.

RIGHT ON CUE


I don't know if the bottom is in, but I do know that right on cue with Cramer's throwing in the towel, the market has rallied about 8 S and P points. The market internals have turned flattish and my recent ETF trades are now in the black. Not great trades, but profitable. The internals have flipped the switch and are now barely green and the major market sectors are greenish to pinkish (barely red). Pay attention to Cramer at your own peril. Hopefully the markets can ramp and I can sell out and get ready for what I foresee to be a signifcant sell off. Speaking of Cramer, here he is telling us the consumer defensive stocks are the place to be. Tomorrow, no doubt, he will have a different take.

2:00 UPDATE

Well look at that, the market internals have improved rapidly to about 700 lower than higher, the BANKS, IWM QQQQ are all greeen and the SEMIS are trying. The OIL's are red with the OIH down a buck. The SPY is about flat and the all important DJIA is flat on the day. Rally time? I suspect the close will be very important today.

CONTRA TIME

Well it has been too long I guess since I mentioned that guy on the realmoney site. I just wonder if he still remains a good contra indicator. After saying "can't quit a market that banks lead" only yesterday, now he says "But today's a daunting day. To ignore it is to pretend that all is well, and it can't be with this tape's coloration." Someone tell me why this guy is such a phenom to so many?

NOT TOO PRETTY


The markets are looking none too pretty as we head into the afternoon. The only green things on my screen sans the Volatility Sisters, are DNA AMGN and C. Everything else is lower. SEMIS BROKERS and OILS all about 1.5% lower. The market internals are red by 2400 and the newly watched 10 year Bond is flat. One thing I noticed is that if the market internals close at these levels, the adv/dec indicator that I mentioned earlier will be -875. The last time it was at those levels was around October 11, 2005. Yes that is correct, the October lows.

MORE TECHNICALS

Another indicator that I find useful when trading ETF's is a moving average of the advancing and declining issues on the NAZDAQ. Generally, the markets will be oversold and ready for a bounce when the 5 day average of declining issues outpaces the 5 day average of advancing issues by 400 or more. To compute, sum the advancing issues for the past 5 days and divide by 5 and compare that to the sum of the prior 5 days declining issues also divided by 5. If this number is negative 400 or more, it is generally a good time to buy. The reverse is also generally true for overbought markets. Yesterday, according to my data provider, the number was -362.

Here are some prior signal dates:

Feb 21 +310 SPY 128.49
Feb 13 -418 SPY 126.43
Feb 7 -434 SPY 125.48
Feb 1 +386 SPY 128.39
Jan 27 +518 SPY 128.57
Jan 11 +482 SPY 129.31
Dec 30 -358 SPY 125.19
Dec 20 -501 SPY 125.83
Nov 22 +485 SPY 126.3
Nov 3 +684 SPY 122.27
Oct 10 -765 SPY 118.77

GREEEEEEEEEEEEEN??????


The markets are trying their darndest to turn green but the fly in the ointment right now are the internals. Still as the QQQQ and SPY are basically flat, the internals are 1800 to the red. The financials are mixed, the 10 year is flat, oils and small caps ditto. AAPL generally a pretty good early tell is green by almost 1%. Another overhang on this market is the GOOG GOOF. Not sure why those folks can't just play the game.

Morning Random Links

3.07.2006

TECHNICALS


Today on the realmoney site, Cody Willard, a trader also known by other names (trimmer/nibbler) makes the following keen observation " I think the VIX is yet another mostly worthless, noisy indicator that most investors/traders should simply ignore." I wonder if our trimming nibbling friend would be saying something different if he saw the 2 charts lined up as they are above? Also, note the turnaround interday day on the VIX and the SPY. The 2 day RSI on the SPY is 10 and the VIX hit the 110% above the 10 day SMA during the day today. Lets see how these indicators play out over the next few days.

BROKEN CLOCK


I am not sure if the bottom is in, but I do know that if you bought ETF's after about noon eastern time you are in the black or just about anyway. I expect the markets to trade higher over the next few days as it will take that long to relieve the oversold conditions. Note the ill concieved DJIA green by 22 NAZ -18 and SP500 -2.5 on the day. There were less than 1800 issues higher and more than 4500 lower on the day. The reason the DJIA is a silly index is because it is price weighted and therefore when a stock splits two for one, the stock becomes 50% more unimportant in the index. That becomes very significant when there are only 30 stocks in an index. Does that make any sense to anyone? Oh, the CNBC anchors because they obsess about the DJIA all day long.

2:00 UPDATE


The market remains lower with the NAZ leading the way down -21. All of the major sectors are red except for the Banks with C green by 20 cents. The markets are still due for an oversold bounce and I expect one before the day is over.

BOTTOM IN?


That is the question for now. The market internals are still ugly at red 2300 (but improving), the Banking index has turned green, the Brokers and just about every other index is still red. The 10 year bond has stabilized and the DJIA, the worlds most famous and most poorly constructed index is +19. I still think we get the oversold bounce starting the afternoon.

THE STARS SET


The signs of a bounce seem to be all aligned as the 2 day RSI on the SPY gets under 10 and all the Volatility indexes are at or above 110% of their 10 day SMA. Even another indicator I use, a short term moving average of the net adv/dec lines is showing oversold. So scaling in for a short term flip seems like the correct move here.

24/7 GRASSO

The markets open down with the major indexes not really reflecting how poor the action is. The internals are red by 2500 issues and the SOX and BROKER indexes are lower by more than 1%. The only green I see on my screens are AMZN and the Volatility indexes. On another note, please do not tell me we are gonna be all Dick Grasso all day. Note to CNBC, how about discussing a way the viewers can make some money. Discussing Grasso all day does nothing but fill time. One other note, I am dipping a toe in and buyng some index ETF'S here for a quick flip.

DIVERGENCES


Our friends at INVESTOPEDIA say the following about divergences "divergence is considered either positive or negative, both of which are signals of major shifts in the direction of the price. Positive divergence occurs when the price of a security makes a new low while the indicator starts to climb upward. Negative divergence happens when the price of the security makes a new high, but the indicator fails to do the same and instead closes lower than the previous high." The image above is a better illustration of a classic NEGATIVE DIVERGENCE.

I think that is where we stand on the SPY and the IWM although probably not the drop that RGLD incurred.

SPY TECHNICALS

The SPY chart above is starting to look, well yes, like a trading range. The 2 day RSI is at about 14 so if there is morning weakness I intend to buy. However, I do not like the looks of the market so I anticipate it will be a quck flip. Also, note on the MACD indicator below the chart that as the SPY makes higher highs, the MACD lines make lower highs. That is a BEARISH NEGATIVE DIVERGENCE.

IWM TECHNICAL

Here are the technicals on the IWM. The price on the IWM was higher on friday than it was at the beginning of February but the MACD indicator was much higher at the beginning of Feb. That is another arrow in the sling for the bears as it is another NEGATIVE DIVERGENCE. When the prices make a higher high and the technical indicators don't its time to be very careful on the long side.

3.06.2006

Random Links

WRONG!!!!!!!!!!!!!!


That wasn't a very good prediction on the mkt today by yours truly. So I am eating crow and I will lay the blame on the bond market as the 10 year rallied to 4.74%, up over 1% on the day. The good news is that the indicators are starting to lineup for an oversold rally. The SPY is at a 2 day RSI of about 14 and the VIX isn't quite at the overbought level I like to see (10% above its 10 day SMA). If we have weakness in the morning, I will be buying as the indicators will be aligned.

SECOND THOUGHTS


It always bothers me when I agree with Cramer because I know how wrong he has been and lost so many people so much money. Just check out this article he wrote about the giant merger between AOL and Time Warner, or check out this one, where he wrote that the merger would save the tape, or this one where he talked about the new must own stock. It is hard to believe that someone who was so caught up in the internet bubble could be so influential only a few years later.

The Latest on Oil Stocks


Jim Cramer, on realmoney is saying that owning oil is difficult here and might lead to underperformance. "At what point do people say owning oil is just too hard. I believe that point is rapidly approaching. Despite my affinity for the group, it's just playing too much havoc with performance. I thought of that this weekend when I recognized that almost none of the stocks that Investor's Business Daily focuses on in its 100 list is still oil. The momentum is gone, courtesy of the endless backing and filling. The incredible decline in natural gas has made people feel that the whole run has been an aberration. Which is too bad, because that's just untrue. But fighting it has been way too hard. "

I actually think Cramer is correct here. As the price of oil fluctuates and doesn't go up in a straight line, most of the oil stocks have just bounced around. One day we probably will get the spike to 80 or 100 and the oil stocks will rip higher, the only problem is they may rip from 20% lower than where they are now.

12:00 FLAT


The markets have done nothing so far today and the old adage is "don't short a dull market." Well this sure is a dull market. Banks, Brokers, Semis, Biotechs, Small Caps all flat. Market internals show 750 more losers than winners so that is also flattish to net pink. Oils are way down. I still expect an afternoon pop higher on the broader averages.

10:00 Look


The markets opens little changed with the DJIA flat, Nazdaq flat and the SP 500 -1. There are about 1,100 more losers than winners and the BANK, OILS and BROKERS are a bit red while the SEMIS are a bit green. The only thing of any interest that I see is that the little telecom companies like MRVC AVNX and FNSR are all way up. I have a suspicion that this continuation of late friday's dip will be bought.

3.05.2006

STOCK PURCHASE CANDIDATES

One of the newspapers that I read every day is the Investors Business Daily (IBD). This newspaper is a great tool to find stock ideas and read stories about up and coming companies.

The paper is best known for its technical ratings of stocks and its IBD 100 stock list, which they update on a weekly basis. IBD 100 stocks are generally stocks registering the greatest earnings per share growth and the best stock price performance.

IBD measures Earnings Per Share growth (EPS) by ranking earnings growth over the past three years with a heavier emphasis on the two most recent quarters. Each stock is rated on a relative basis on a scale of 1 to 99 with 99 being the best.


Relative Price Strength (RS) measures a stock’s change in price over the most recent twelve months. The stock’s price 12 months ago is compared to the current price. The change is compared to the current price and compared to all other stocks. The rating is again between 1 and 99 with 99 being the best.

These stocks have a tendency to be very volatile and a great deal of money can be made on them. The opposite is also true and if one were to take a shot at any of them my advice would be to spread the risk by buying limited amounts of any one stock or any one industry. In addition, scaling in to purchases is the only way to buy these stocks. In other words, don’t buy a full position at once.

I find the stocks below to be of interest at this time:
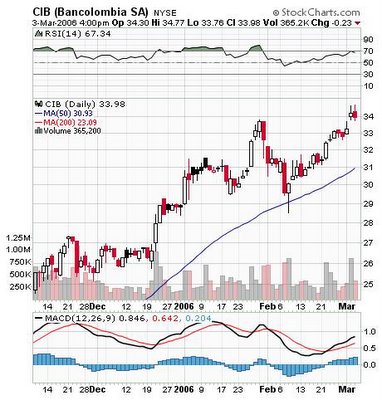
CIB provides banking services to business and individuals in 127 cities in Columbia. It has an EPS ranking of 95 and a RS ranking of 95. There are approximately 182 million shares outstanding and it is currently about 2% off its 52 week high.
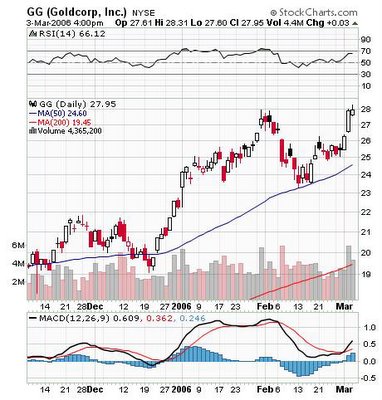
GG is engaged in the acquisition and development of precious mineral properties in the Americas and Australia. It has an EPS rating of 98 and a RS rating of 94. There are approximately 340 million shares outstanding and it is at its 52 week high.
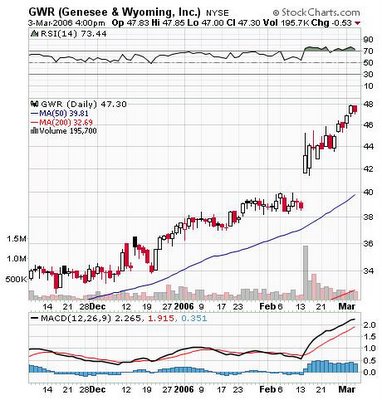
GWR operates shortline and regional freightline railroads in the U.S. and South America. It has an EPS ranking of 91 and a RS ranking of 93. There are approximately 27 million shares outstanding and it is just about at its 52 week high.

INFA is a developer of enterprise data integration software. It currently has an EPS rating of 99 and a RS rating of 94. There are approximately 81 million shares outstanding and it is about 5% below it 52 week high.
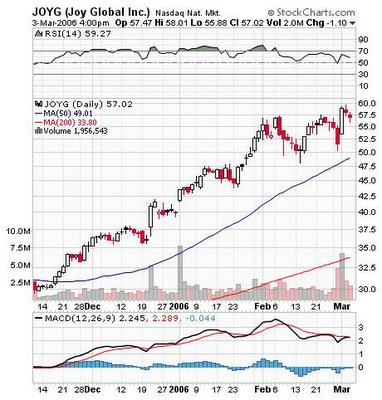
JOYG is a manufacturer of mining equipment, longwall shearers, electric shovels and blasthole drills for coal mining extraction. It currently has a 99 EPS rating and a 97 RS rating. There are approximately 121 million shares outstanding and it is about 5% off its 52 week high.

LINKFEST