5.13.2006

THE NUMBERS ARE IN


I must admit I am a bit nervous this weekend about the markets. Dr. Brett, however, has done some homework on the setup of the past two days. His findings:

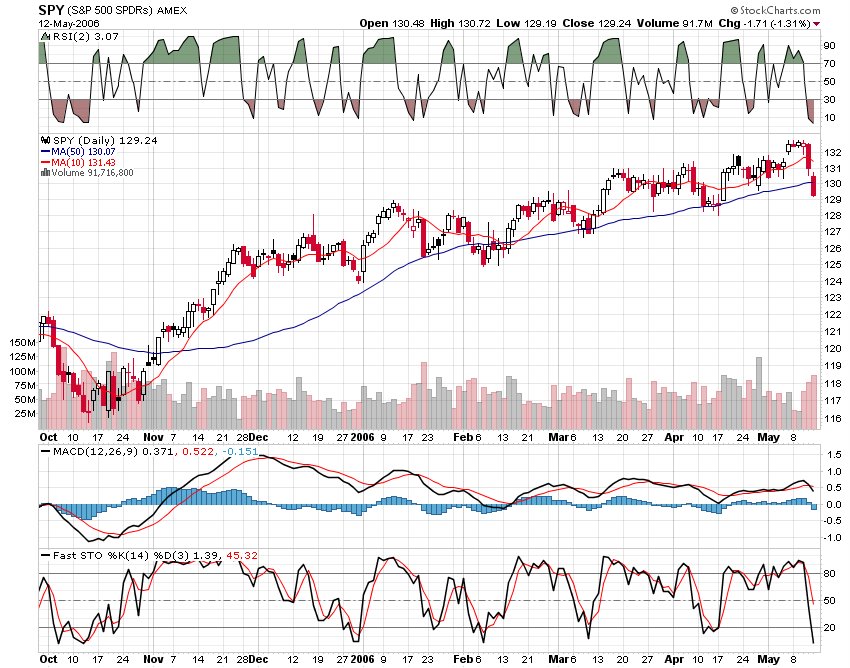
"We had two consecutive days on Thursday and Friday in which 70% or more of traded issues declined on the day. Since 1990 (N = 4124 trading days), that has only occurred 13 times. The next day, the S&P 500 Index ($SPX) was up by an average .59% (9 up, 4 down)--much stronger than the average daily gain of .04% (2174 up, 1950 down) for the sample overall. Two days later, the S&P was up by an average 1.37% (10 up, 3 down)--considerably stronger than the average two-day gain of .08% (2209 up, 1915 down) for the 1990-2006 sample. What that tells us is that two consecutive down days of very negative breadth is a rare occurrence. It is also interesting that 7 of the 13 next day occurrences led to price changes of greater than 1%, suggesting that volatility follows broad two-day declines."

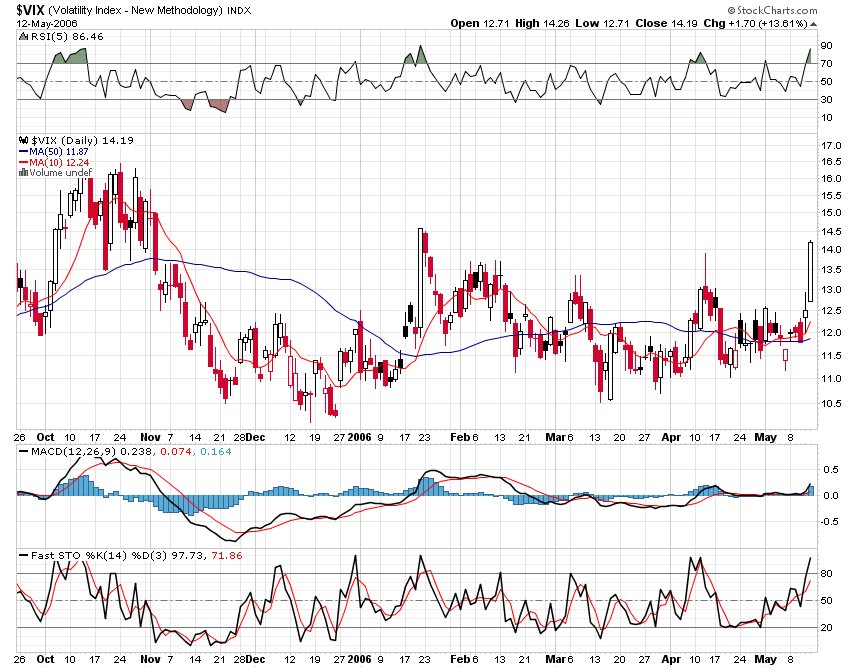
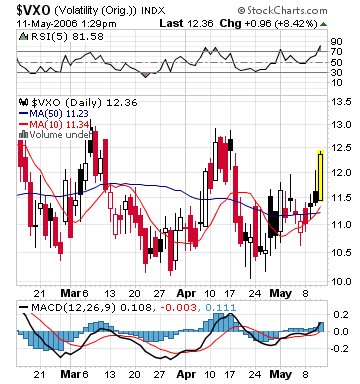
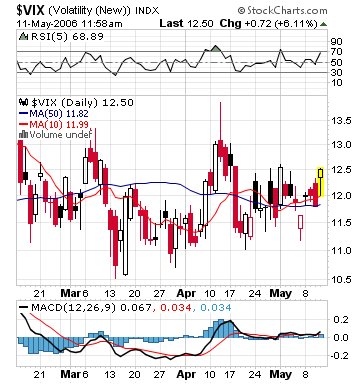
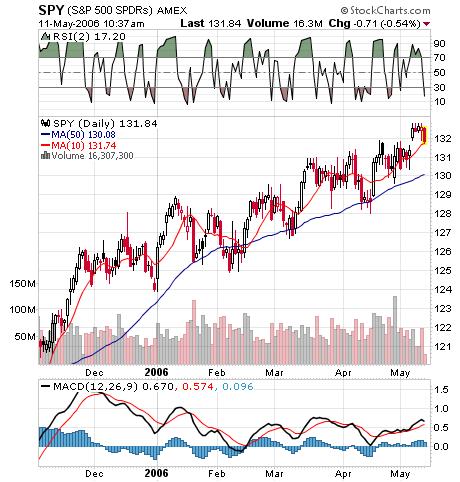
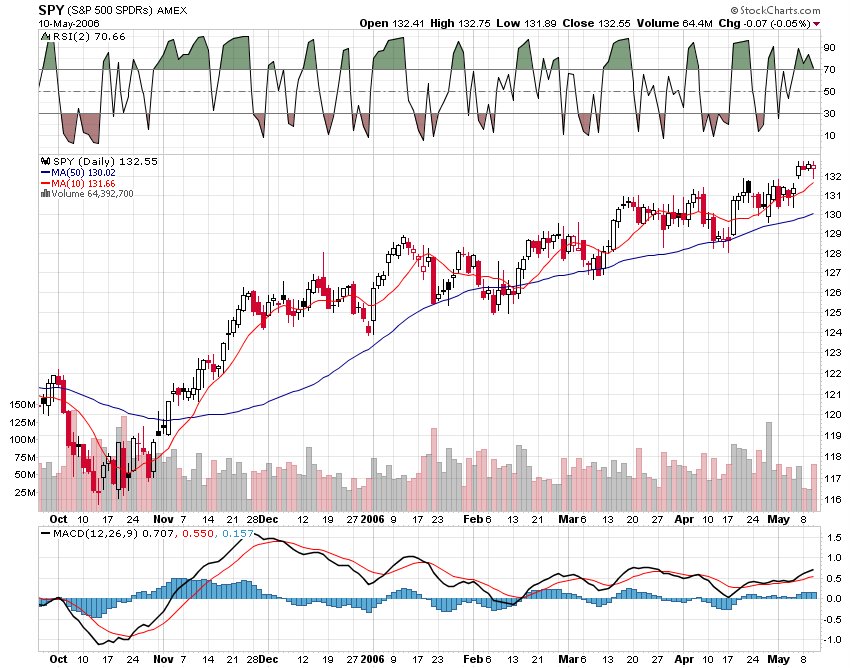
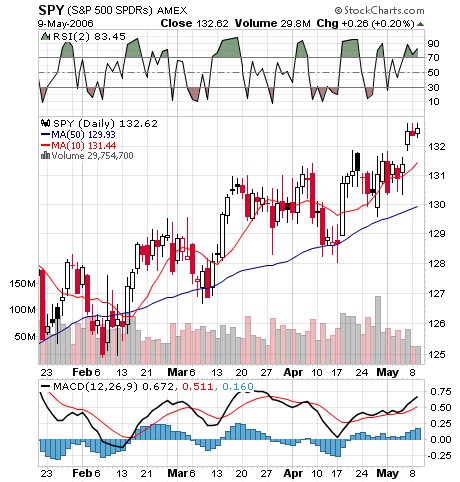
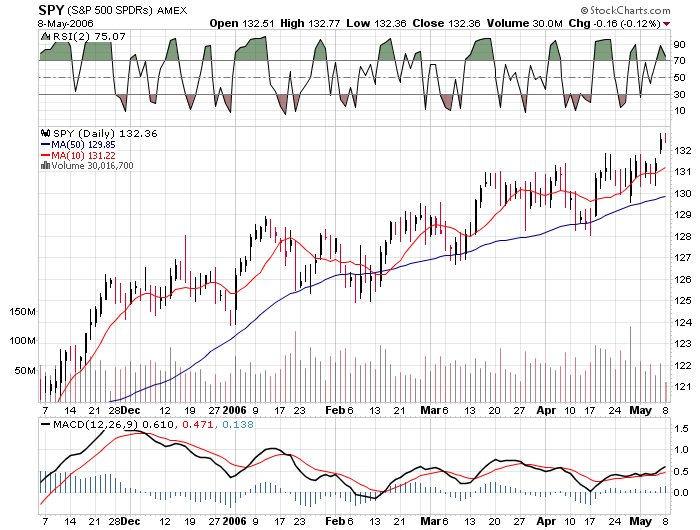
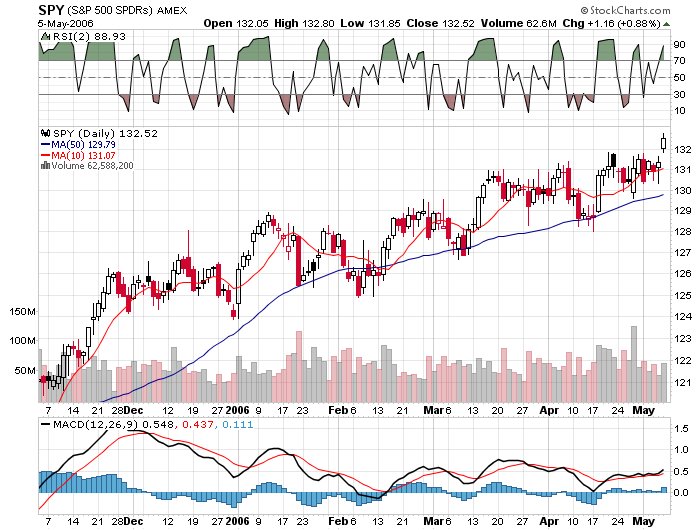
I am optimistic about the markets for next week and I bought ETF's on both Thursday and Friday due to the buy signals I received on the VIX stretch, the extremely low 2 day RSI readings, and the most oversold breath numbers seen in a long time. If one wants to succeed as a trader, one needs to step up when the signals hit and the buy signals are everywhere.

I will address the STOP OUT area when and if the markets do not cooperate early next week.


5.12.2006

STRETCH


Ugly day on the street as the SPY closes at the 129.2 level and the VIX is all the way back over 14. The VIX stretch from the 10 day SMA is 16% which is reminiscent of the way it was back in mid October of 2005 (market lows). Everything else is also stretched so there should be some interesting action on Monday.

BROKEN RECORD


I am beginning to feel like a broken record, but watching this VIX is getting me nervous. It just closed over 14 which is the highest since last November. It is about 15% above its 10 day SMA so I guess Monday will be a very interesting day. I am sure there are lots of nervous traders and investors who will be very curious to see where the futures begin trading on sunday evening.

The internals never blinked as they closed near their lows of the day with about 3,500 more losers than winners. The Oils got pounded as the OIH took most of the heat down over $6. Puts for sale? The metals also got smoked as the major metal indexes lost about 4%.

The one sector that gives the bulls some hope that an end to the selling may be near is the Semis. The SMH closed the day down 25 cents or .7% which is a far better showing than the major market indexes (-1.3%).

Tony Dwyer of FTN, who has been spot on with his market forecasts, appears to be shrugging this selling off as a pullback in a longer term bull phase. I tend to agree but next week should be quite the tell.

THE LOSER IS?

The biggest loser of the week question now going on at CNBC. That is an easy one, the biggest loser on the week is CNBC with all there blather about the all time high in the DJIA. Now the anchors sit there and hope that the markets don't crash as that would really hamper their ratings. Ever wonder what happens to the ratings as the market tanks? I am sure ratings tank right along with the markets.

It has been an interesting day as the Dolphins traded for Joey Harrington, Gatlin breaks the 100 meter record and Janet Evan's long standing record in the 400 meter freestyle is gone.

Jimmy's advice for the day, buy some SLB and I can't disagree with that and glad he finally decides to buy lower. AMGN also and I will go with that one too.

WORRY?


The revshark on realmoney.com is making some comments about the selloff of yesterday and today and he says:


"In this difficult market, it is very important that you remind yourself that things are seldom as good or bad as they seem. With two days of ugly selling, the perma-bears who have been wrong about this market for many months are doing high fives and advising us that this is just the beginning of something much nastier. Their arguments, which were ignored for so long, are now taking on great relevance in their minds.

This is just a good old selloff. They occur several times a year and sometimes turn into downtrends that last for a while. You can easily convince yourself that we are in for a reversal like we had in 2000, or even a crash like we had in 1987, but that is a very long shot. It is particularly important that you stay calm, raise some cash and not be overly anxious to bottom-fish. We should be defensive here but don't get caught up in the dire predictions, which are going to become increasingly loud today. "

I think Revshark nails it with these observations.

FEAR AND GREED

Fear seems to be winning out so as the market continues to drip lower and the Volatility indexes continue to move higher. The Volatility sisters now are all up another 7.5% or so and are all officially overbought and giving out the best buy signals that I know.

The Semi's, usually the first sector to head down and the first to head up is also hanging tough as it is only down 6 cents. The banking index is also down about 1/3% so there is some hope that these leading sector groups will show us the green shortly. There is also lots of chatter about a black Monday, but I do not see that as a likely scenario.

Anyone notice that the QQQQ is now red on the year.

UGLY


The only things bouncing on my screens are the Volatility indexes and they continue to shout BUY. Hard to believe one should be buying into this carnage but if you want to buy lower, well, this is lower. One other thing, who is more scared now the bulls or the bears (fear).

My oversold Naz breath indicators are the most oversold they have been since March 9, 06, October 11, 05, August 9, 05 and April 28 05. All those days turned out to be pretty good buying opportunities.

The VIX is back over the bar mitzvah level of 13 and has a 5 day RSI level of 80. Again, a Larry Conner's buy signal on the SPY when this level goes above 70.

So there are buy signals galore and as I said earlier, these buy signals usually work so hold your nose and dip into the muck. It seems it was a heck of a lot easier to buy a few days ago when the DJIA was spitting distance from the all time highs.

OPENING CHECK


The markets have opened lower and the buy signals are certaintly all over the board as CNBC keeps searching for the 10% selloff. Where are Steven Roach and Richard Bernstein, the two influential strategists who only a few days ago turned more bullish on the markets. Any chance they show up on TV today?

The SMH has turned green and is up almost 2/3 of a % in spite of all the bad news. The VXO romped to almost 11% above its 10 day SMA so is the bottom in? I surely don't know, but I do know that these "signals" have flashed before and they have worked more times than not.

The market internals are ugly as they show 2,400 more losers than winners. The sectors in the green are drugs, semis, internets and the financials. Interesting also that JEF MER MS are all marginally green. I say continue to scale in and leave some ammo available.

QQQQ CRASHES

James Altucher of realmoney.com wrote a book called Trade Like a Hedge Fund and in the book he details a trading strategy called "The QQQQ Crash System." Guess what; the system triggered a buy signal yesterday and according to the strategy, which has been correct 100% of the time (61 out of 61 trades successful), one buys the QQQQ on the open.

The crash system triggers a buy when the QQQQ closes 1.5 standard deviations down from its 10 day SMA. According to the book, using 1.5 standard deviations guarantees that the move is larger than 90% of the moves the QQQQ has made in its then four year history.

TECHNICALS - SPY


It did not take long for volatility to revert to the mean. I mentioned after Tuesday's close that the range in the SPY for both Monday and Tuesday was 41 cents and low and behold yesterday we get the big move of $2.03. I suspected the move would be lower as the gap from last Friday remained unfilled. Keep in mind that the typical move in the SPY for a day is about one dollar so I guess we have to mean revert again.

The question I try to ask myself is not where we are in the markets but where we are going. The longer term chart points to higher and we are now quite oversold. I bought into yesterday's carnage and anticipate adding more SPY today. The 50 day SMA is a bit above the 130 level and touching that area would not be surprising. Buying the dips in the markets has worked every time for about three years so the odds are with the dippers.

The VIX/VXO duo has not quite hit the major overbought level of 10% above the 10 day SMA but it is getting close. Hopefully with the dip in the futures this morning the Vol sisters will ramp up and the final buy signal will be in place.

On a final note, it is quite interesting to watch bubblevision. Just a few days ago Kernan and the other bubbelites were asking each and every guest about the all time high in the DJIA and when we would hit it. Today each guest is asked if this is the beginning of the 10% correction. I guess this is why they are only allowed to own GE stock.

5.11.2006

ONE MORE THING - IWM


The IWM took it on the chin big time today (minus 2.2%) but it still sits a bit above its 50 day SMA. If one looks at the chart, two things stick out like a soar thumb; (1) Its in an uptrend, and (2) It always seems to bounce at its 50 day SMA. So the next few days could be very important for the little guys.

THE CLOSING BELL


So just one day ago we were all excited about new all time highs on the "dopey" DJIA and Jimmy tells us what a crummy place the U.S. markets are to invest. Please someone tell me his show is going off the air or that Donald Trump is firing him.

Bernie Schaeffer was on CNBC a while ago and said the small and mid cap stocks are in long term uptrends and one should pick days to buy the pullbacks. I guess today is one of those days and why doesn't Bernie have a TV show? I guess because they want investors to be like CNBC anchors, excited about up days and depressed about down days and not helping folks make money by taking the emotions out of the equation and buying lower and selling higher.

The market internals are closing near their worst levels of the day and probably the worst I have seen in a long time, almost 4,000 more losers than winners. The SPY is back to the 130.6 level with very oversold readings on the 2 day RSI of 7.

The VIX/VXO twosome are also closing much higher and are both stretched a bit less than 10% from their 10 day SMA's so a bit more downside may be in the cards. I have been scaling in to QQQQ and SPY all day and will continue to do so tomorrow.

On another strategy front, I sold more XLE puts into the afternoon dip and will continue to do so if they go lower.

MORE SIGNALS


Revshark tries to tell us to trade without emotions on the realmoney.com site, and he may be talking about some other commentator(lol):


"The most important thing you can do in a market like we have today is to keep your emotions in check. When you see red across the board, it is very easy to become depressed and discouraged. There usually is either the inclination to dump everything, or a feeling of being frozen and incapable of making any moves at all. Both those behaviors are the offshoot of confusion and rob you of the opportunities that arise when emotions are running high.

It is extremely important that you don't start buying into the feelings and emotions of the folks who are always the most bearish at the lows and most bullish at the tops. When you start seeing repeated arguments about how commodities won't stop going up and technology won't stop going down at any time in the near future, you can bet that we are getting close to an extreme point in the action. "

I wonder who he is talking about(lol)?

The action is getting uglier on the street as the DJIA is now down 130, SP500 down 16 and the NAZ down 41. Generally, the most the DJIA will go down in any one day is 150, and the usual limits on the NAZ and SP500 are 40 and 15 respectively, so we are already there.

The VXO is now up 9% on the day and now sits over 8% above its 10 day SMA. More buy signals, although I have a sneaky suspicion we may have to go a bit lower before the carnage ends and that is why I continue to scale into SPY and QQQQ. The 2 day RSI on the SPY now sits at 8 and 3 on the QQQQ. The stars are aligning and a little more liftage on the VIX and we will be set.

One other signal that Larry Conners of TradingMarkets.com mentions is to buy SPY when the VIX/VXO trades at a 5 day RSI of 70 or above. Well there you go, its now over 80, another signal to chew on.

VIX FLIPS

The VIX is getting a bit jiggy today with the markets tanking after more thought about fed speak. Well there has to be some reason, maybe because W is focused in on my IM's with other traders, gotta be some reason.

Anyhow, the VIX is now trading at about 5% above its 10 day SMA and rule number something says the market rarely makes much downside progress when the VIX is that overbought. In addition we now have the SPY trading at a 2 day RSI of around 10 so a buy signal finally appears on SPY to go along with IWM (6) QQQQ (4) SMH (3). So pick your poison or spread it out. I presently own all but the SPY but that will be my next purchase on a scale basis.

If the markets sink further and the VIX/VXO sixters go higher, I will be buying. The longer term chart is bullish and everytime there is a selloff it has been a buying opportunity.

GAP FILLED


Hey, how about that,and just like that last Friday's gap on the SPY to 131.5 gets filled and Bob Pisani is looking depressed.

The numbers are also interesting as now the QQQQ and the SMH have 2 day RSI's under 5 so if you want to buy lower those ETF's may be worth a look.

The Volatility indexes are not confirming any buy signals "yet" but maybe before the day ends. Jimmy Cramer also penning some dopey column called "Can't Count on Anything but MICA to Work." It was just the other day when he was screaming about what a great market this is and how everything is working.

ISSUES ISSUES

More Tech problems this morning. Hopefully they will be resolved shortly. LOVE MY DIAL UP.

5.10.2006

BRUTAL


A very frustrating day at my trading turret as the internet connection worked off and on but mainly off.

The markets acted a bit differently as the SPY range expanded to 86 cents, a step up from the recent 45 cent range. I still think that more volatility is headed our way and my guess is lower as that gap from Friday still needs to be filled. As I mentioned yesterday, it is rare for a gap not to be filled and if you look at the above chart you will see that every other gap since October was eventually filled.

The Volatility indexes have given us no signals and the NAZ/SEMI's are underperforming the bigger caps. This does not bode well as the techs should lead in a bullish market. I guess there just is not much in the way of commodity/metal stocks on the NAZ.

CAN'T BLAME GOOG

Up and running again as I suspect the issue was VZ and their FIOS service. Thankfully I didn't miss much as the market just chops around.

The fed heads add to the complications in the market as they put the word "yet" into the statement. Talking heads hopefully won't spend too many more hours trying to decipher the exact meaning of what "yet" "is."

The Oils have been interesting today as they refuse to go lower.

Market internals presently show a little more than 1,000 more losers than winners and the losers are predominantly on the NAZ.

Interesting that the homies are up almost 1% and the metals after running big yesterday are basically flat.

CNBC is keeping a close watch on the hoped for new high on the DJIA pretty much ignoring the ugly NAZ and the especially ugly Semi sector.

TECHNICAL ISSUES TODAY

TECHNICAL ISSUES TODAY-

VOLATILITY


Food for thought; the SPY traded in a range of 46 cents on Monday and Tuesday. Yes, the high of both days was 132.77 and the low was 132.31. Generally, the SPY trades in a range from high to low for one day of over one dollar, so the range of yesterday and today is very low and very unusual. The QQQQ traded no differently as its range from high to low for the two days was 31 cents.

The adage is that volatility is mean reverting so one would expect volatility to increase shortly. Today is Fed day so maybe we get the volatility we want after the 2:15 announcement.

One thing to keep on the radar; the gap up on Friday. That gap is still in play and today could be the day it gets filled. The gap needs to get to the 131.5 area on the SPY to fill and that is one buck of volatility right there.

5.09.2006

STORY OF DAY OSX NOT DJIA


The DJIA is closing at yet another six year high and the rest of the market, well who cares about the rest of the market. Maria is attributing the strength in the market to the new tax deal that is apparently done on capital hill. A letter to Maria, there are more than 500 stocks down on the day than up. Do you also want to attribute that to the new tax bill?

CNBC always focuses on the indexes that are doing well. How many times did they mention the trannies? Does anyone keep their eyes peeled on the transportation sector? sure.

Instead of focusing on the DJIA, they should be focusing on what is important today and that is the metals and the oils. How about telling us how the Semi's took it on chin as DELL got smoked.

It looks like the OSX has made a new all time high today and the metals indexes, HUI and XAU have made at least new ten year highs today. THAT IS THE STORY OF THE DAY AND NOT THE DJIA. The DJIA is a dopey price weighted index where a stock selling at 60 has three times the impact as a stock selling at 20. Whose idea was it to use a price weighted index for the DJIA? How dopey.

THE SILVER STANDARD

SSRI, not surprisingly, hit a new high today with the ramp in the precious metals group. It is my biggest metals position and I am wondering if I should take some off the table into the new high. It is prudent to sell some but I think the metals have further to go as the dollar will probably continue to go trend lower. I also don't expect peace to break out all over the world which will also lead to higher metals pricing.

Outside the metals group, there really is little action of any interest. GOOG is now up 10, AAPL is down a buck and GEMS a recent big under $10 mover on IBD is off by 36%. There is not much money management could have done on GEMS as it plunged on earnings news and the announcement of lost business. It is all part of the game and the lesson is not to have an oversized position in any one stock.

TERROR PREMIUM


Still have not heard a word about the terror premium in Copper, but I guess its there somewhere as the price has rocketed straight up from 2 to 3.6 in a couple of months. The crude picture is a bit different and today could be an important day on the chart. As I type, crude is trading in the $71 area and if it holds it looks higher, if it breaks through the $69 level it could head back to the low $60's. I guess it could do anything, but for now I will go with higher as W says he doesn't want to have an Iranian pen pal.

The major market indexes are mixed as the large cap DJIA (+34) continues to outramp the Small caps (flat) and the QQQQ (-.38%).

Market internals are also flat. The story remains all about commodities as the gold indexes are higher by over 3%. The 10 year Bond is staring at a 5.15% handle and that is causing lower prices for financials and homies. SMH is down 1% and that may approach a buy signal later this afternoon if the drip continues.

THANK YOU GOOG

Late posting today as GOOG is no doubt inundated with bloggers who are slowing the systems.

The markets are getting set for new six year highs(thanks CNBC)today as the DJIA rips 17 points higher as the SPX QQQQ and IWM all trade flat to lower. The winners today are clearly the precious metals (+2.5%) and the oils (+1%). My least favorite gold stock, KRY, trades down another percent as the yellow metal tries to climb to the $700 level. Funny how KRY and gold are correlated, Gold goes up and KRY goes down.

The losers today are in the tech sector as DELL spreads its stink to the Semis and other big cap tech. The brokers and the banks are mixed and the market internals are slightly red with the NAZ RED and the NYSE slightly green.

The purchase yesterday of JOYG is acting well as it joins the metals up over 2%. The recent OIH/XLE put sales are looking pretty as the prices of the puts drift lower to the eventual (hope) price of zero. Calling for the end of the Oil trade has not been a winner as the way to play has been "buy the dip" for at least the last few years.

SIGNALS


I haven't focused on the SPY numbers lately and I guess its because there probably isn't much to do except sell. The VIX sits right at its 10 day SMA, so we aren't getting any signals from that index and the SPY has a 2 day RSI of 75 indicating it is or was a time to sell. My major problem with owning the SPY now is the gap from Friday. My guess is that gets filled before the week is over and that will result in a SPY about a buck lower than current prices.

The IWM and the QQQQ are both at 2 day RSI's over 90 so they are probably at good selling levels and should at least be trailed with stop out orders. The VXN index is also far more overbought than the VIX also leading one to believe that a sell signal is at hand on the Naz.

5.08.2006

ANOTHER SIX YEAR HIGH

The DJIA is set to close at another six year high this afternoon as it rips higher by 5 points as I type at 3:35 eastern time. Can the CNBC anchors hock us anymore about this nonsense. I am only interested in new all time highs in the NAZ COMP, with its all time high at 5,133 is a mere 2,790 points or 54% higher. How come they never mention that? I guess the NAZ COMP is irrelevant or they don't like telling folks their stocks may be lower than they were when they bought them.

Jimmy, is on STOP TRADING NOW and is offering a few more stocks to buy. He is still trying to get to the 1k mark by July 4th although it will be hard (too much vacation time) as he seems stuck at 763. It is too bad that the site that tracks his picks uses such a dumb method of computing his actual returns. The use of the 4:00 close as the cost basis for stocks he mentions only suits a higher performance return that no one can actually achieve. Even with the gap up, Jimmy still can't beat the IWM, and his 6% return on Action Alerts trails both the SPY and the DIA on a year to date basis. No wonder he has such a loyal following.

BORING


It is a terribly boring day on the street but I think that is not uncommon for days after big up days like Friday. The market internals are flat and the SMH, which started the day strong has trended lower since the early morning.

The OIH and the oil stocks seem to be stabilizing after reaching early morning lows. The homies and the metals seem to be the worst performers and their really are no sectors that are standing out to the green side.

JOYG, an old favorite, seems to be stabilizing at the 65/66 level and still sports an IBD RS ranking of 97 and a EPS rating of 99. I am going to start a position here as it looks like it could easily go back to the old highs.

ALL ABOUT THE WARREN


Today, the markets are fairly flat digesting the recent gains. Market internals are slightly red and the sector movers of note are the Oils and the metals, both down 1 to 2%. The brokers are notably lagging today especially in light of the mega merger between Wachovia and Golden West. INTC continues its surge as it is now over 3% higher and taking the SMH with it.

When they aren't drolling on about the recent outperformance of the big cap stocks or interviewing Lay/Langone/Grasso, CNBC is inundating us with all the great goings on in Omaha/Warren and the incredible investment that is Berkshire Hathaway. Why will a company that has a 130B market cap be a great investment in the future? Take note GOOG owners.

I think that Warren does have interesting things to say at times, but the performance of BRK has lagged the broader indexes over the past couple of years by a wide margin. As the chart above shows, he is trailing both the NAZ and the SPX over the last two years by around 20%. It is also not often mentioned that one of Warren's largest position, KO, was double its recent price eight years ago in 1998. Why is that a good use of capital and what are his future plans for KO? Probably not a question that will be asked by any CNBC anchor/reporter any time soon.

10:00 LOOK


The markets are off and running, well not exactly as the major indexes are basically unchanged this morning and the market internals are following suit.

Erin Burnett, one of my favorite anchors on CNBC is convinced that the DJIA has outperformed the Small caps lately but the chart above tells me different. I wish I knew why the anchors at CNBC have all this interest in having the big caps outperform. Do they get a raise? A bigger bonus? Why Erin Why?

There are no outperforming sectors this morning as they are all trading near the flat line. The Oils and the metals are the losers with each down about 1.5/2%. INTC is leading the SMH as big daddy is up nearly 2% on an upgrade. GOOG is lower APPL and SNDK are higher.

THE NUMBERS

Taking a look at the winners and losers for the year as of Friday's close:

The big winners for the year are OIH +28%, XLE+17%, GLD +32%, XBD+20%, SSRI +41.5%, HUI (gold bugs index) +37%.

The notable losers are INTC -22%, MSFT -8.6%, HHH -16.3% and GOOG -5%.

Among the major market indexes, SPX +6.2% DIA +8.1%, IWM +16%, NAZ COMP+6.2%, NAZ 100 +4.1%, Biotechs /IBB +1%, Morgan Stanley Hi Tech Index (MSH) +5.5% and the SEMI Holders (SMH) +3.9%.

Believe it or not, its a STOCK SECTOR PICKERS MARKET.

5.07.2006

BUYER BEWARE


The market has "BROKEN OUT" to new six year highs and according to most commentators its straight up from here. Just be sure not to let the facts get in the way of your trading. My sources that have done their homework and tell me that as a general rule after the market trades at a new 10 day high, the average gain is approximately zero % after one week. The average weekly gain for the markets after they have made a new 10 day low is over 1/2 of one percent. The rule of thumb (listen up Jimmy), do not buy new 10 day highs but do buy new 10 day lows.

In addition, looking at the SPY chart, the 2 day RSI traded well over 90 on Friday and closed at 89, also an indication of a time for selling and not buying.

Looking closely at the chart above, one can plainly see a strategy in this market environment of buying low 2 day RSI's and Selling high 2 day RSI's. We are at the point of a high 2 day RSI (HINT SELL SELL SELL).

The VIX closed a bit below its 10 day SMA after trading 6% below earlier in the day on Friday. Another reason to let the "buy em higher, sell em lower" crowd have their day in the sun.

The final reason not to chase, the SPY has a nine point (90 cent) gap to fill from Thursday's high. The general rule is that gaps like that seldom go unfilled.