4.29.2006

DRAFT WEEKEND LINKS

RUDE CRUDE

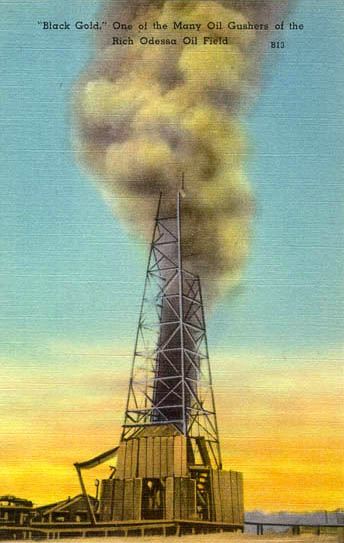
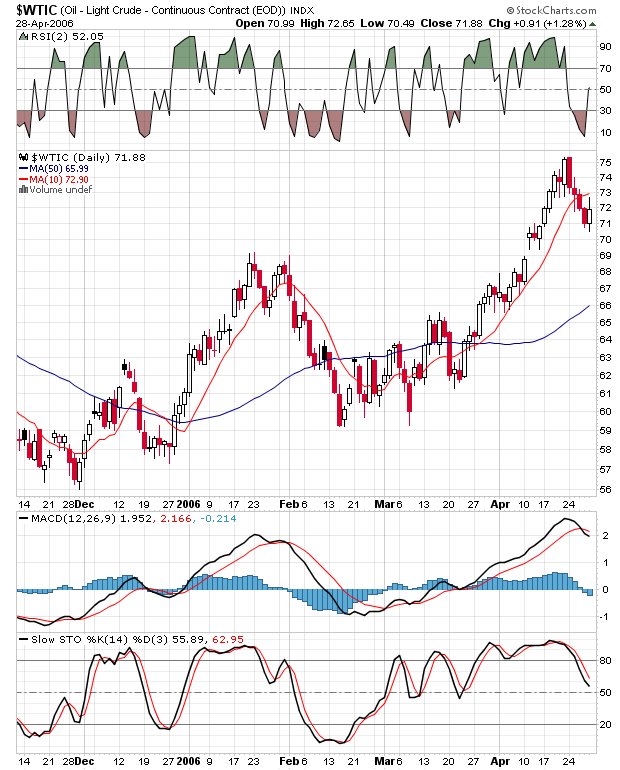
Earlier in the week, I referenced a column from TradingMarkets regarding the price of crude. Looking at the chart above, I think it is playing out as it looks like the next stop for crude is back to 75.

I would play that move by buying OIH, VLO or FTO. All have corrected this week and all look enticing right here. My strategy is to buy the dips and sell them into a big spike ($80/$90 crude) which I suspect will come when we least suspect. See the charts below.

FTO VLO OIH CHARTS


THE BEAT GOES ON


For 2006, the major indexes /stocks that are followed on this site have shown the following returns:

SPX +5%

Naz Comp+5.3%

NAZ 100 +3.4%

IWM +14.2%

HHH -15%

SMH +2.6%

$MSH +4.2%

INTC -20%

GOOG+1%

MSFT -7.6%

AAPL -2%

OIH +22.2%

XLE +14.3%

DIA +6.6%

GLD +26.4%

$HUI +37%

VLO +26%

SSRI +41%

PAAS +32%

$DRG +4%

IBB +.5%

The winners are oils, metals and small caps; the losers are big cap tech and internets.

4.28.2006

WHY?


So why are the BKX up almost 2% and the brokers XBD down more than 2%. Real carnage among the brokers as BSC(-2%), LEH(-3.4%), GS(-2.75%), JEF(-2%) and MER(-2.75%).

Not sure, but I do know that I made a lucky sale of JEF earlier this morning. The SPY is unchanged and the Volatility is 1/2 of yesterdays wild $2 range.

The market internals have been all over the board and now stand at 500 NYSE stocks to the green and NAZ flat.

OIH has been up as much as $5 today but has now flopped back to +$2.00.

The precious metals continue as the best performing sector as both the XAU and the HUI are up over 3%.

Glad I didn't take any new trades today as the action has been choppy and difficult. I am exhausted and done for the day.

REALMONEY CROWD REDUX


Some folks have commented that I knock Cramer too much and miss the really ugly act of the guy who is always covering something into a market trashing and selling stuff into big market ramps. Yes, that be Cody.

Well today I have seen it all. He makes a startling market prediction that MSFT will get into the 50's in a few years:

In other words, it looks like 2007 and 2008 will show big big earnings growth from this crusty ol' tech company (MSFT). And I expect the stock to run into the 30s, then the 40s and, given that stocks usually overshoot to the upside just as they usually overshoot to the downside, why not be optimistic and look for a $50 price target in two years? Call me crazy

Cody, I will not call you crazy, I am not sure what to call you, but do you remember this prediction back on December 15?

"As a matter of fact, with Apple almost going by Oracle in market cap already, I wonder how much longer before it catches Cisco. Then Intel. Then Microsoft? Let me go ahead and be the one to throw it out there first: I wouldn't be shocked to see Apple more valuable than Microsoft sometime in 2007. What a mind-blowing thing to ponder."

I think the real point of the site, which I used to like a lot, is to make outrageous predictions and get publicity. They certaintly aren't making anyone any money with this nonsense.


ONE MORE SHOT


One more parting shot at Jimmy and that is KRY, a pick from April 5. I mentioned in my criticism of the pick that KRY would not necessarily track the price of gold as Jimmy predicted. Note how the price of gold (IAU ETF) has gone straight up and KRY has gone sideways to down. A longer term chart of KRY (not pictured) shows clearly that the price of gold and the price of KRY have very little in common.

HERE WE GO AGAIN


Jimmy Cramer over on realmoney.com is touting the bank stocks this morning noting that they are breaking out (really). He ends his "analysis" of the banking sector with this comment "

"So, be aggressive, once in motion, you need a real catalyst to stop this move. I don't see one on the horizon."

I look at the chart and my analysis is that the "catalyst" to stop this move will be profit taking. Too far too quick and buying at this point is not the high probability trade. Remember all those facts about buying highs and selling lows. Yes, doing the opposite is what works best, so if you want to own financials, I suggest buying pullbacks and today is not a pullback.

JIMMY AND GOLDIE


Jimmy also came out bullish on April 5 in a column called Pounding the Table on Goldman Sachs. At that time, GS was trading at 161 and today trades at 160 after trading up to 169 on April 20.

During that same period, the BKX index, traded up 3% to its new highs today. Jimmy has proven over and over that a day like today is not the time to buy. Buying GS today makes much more sense than buying the BANKS.

DON'T GIVE A DAMN

The market internals have turned positve and are now 1K to the green as the MSFT news is being ignored. The leaders are still metals and oils but Small caps have also recieved a bid. The other issues sticking out are the jig in the financials excluding the brokers, APPL, and why is INTC flat to green on the day with MSFT getting torched? The bottom is probably in on that one.


In addition, the markets don't seem to give a damn about the news out of Iran this morning and the comments of the Iranian leaders. Here are the highlights from a CNN article:


President Mahmoud Ahmadinejad said Friday that his country would pay no heed to international calls to stop its nuclear program, according to Reuters."Those who want to prevent Iranians from obtaining their right, should know that we do not give a damn about such resolutions," Ahmadinejad said, Reuters reported, citing the state-run IRNA news agency.

Iran maintains its nuclear research is for a future civilian energy program, but the United States and other allies contend the work is a guise to hide the country's development of nuclear weapons.

Speaking Thursday, U.S. Secretary of State Condoleezza Rice said Iran was "highly unlikely" to bow to international pressure to curb its nuclear program.

The international community "cannot have its will ignored," Rice said at a NATO ministerial meeting in the Bulgarian capital of Sofia.

On Wednesday, Iranian Supreme Leader Ayatollah Ali Khamenei vowed to retaliate against any U.S. action, according to IRNA.

"They will suffer two times if they dare to inflict any damage on Iranian interests," Khamenei said. (Full story)

Any quick agreement by the council on what action to take seems unlikely with permanent members China and Russia opposed to using sanctions. Both nations called Thursday for greater diplomatic efforts to be made to resolve the nuclear standoff.

"We hope the relevant parties can keep calm and exercise restraint to avoid moves that would further escalate the situation," Chinese Foreign Ministry spokesman Qin Gang said.

When I read Condi's comments, I do not get a warm and fuzzy feeling that this issue will just blow over.

$30 BILLION SOLD


The markets are open and they are MIXED. The SPY is trading at 131.2, the QQQQ is down .5% on the heels of the MSFT crushing (down 11% or over $30 Billion in market cap) and the OIH is up over 2% to the 159 level. The precious metals are also leading higher by 2% plus as the SLV silver ETF begins trading.

The market internals are green with 600 to the plus side on the NYSE and flat on the NAZ. Ten year Bond yields are back to a 5.07% yield as the BKX (banking index) trades to new highs (+1%).

The Pivot Point on the SPY is 130.75 and the markets bounced off those levels at the open. Resistance is the 132 level and support today is 129.9. A wacky day already in light of the MSFT debacle and the ramping financials. I plan on doing very little.

ALL ABOUT YESTERDAY

I was away from the trading turret yesterday, but it looks like it was quite a day. The SPY had an outside range day (over 2 bucks) as it hit the low of the day in the first fifteen minutes of trading at its 50 day SMA (129.6 area), hit its high around noon at the top of the recent trading range, and then dribbled back down to the 131 area into the close.

My strategy for today will probably be to do nothing as I don't expect much action. Looking at the chart above, one can see that recently the SPY has been all over the board with several days of ranges in excess of $2 or twenty SPX points. Volatility reverts to the mean and hence I expect a quiet range bound session.

The IWM has been disappointing lately and it has been underperforming the bigger indexes. This is not a good sign for the near term direction of the markets and I expect lower prices all around. There is much angst in the markets as many stocks have "blown up" on recent earnings news and the recent momentum stocks are acting quite poorly (NDAQ BRCM MFLX TRID MRVL).

My strategy for now is to wait for my signals on the buy and sell side and not to hang on too long. All the momentum indicators look very bearish on an intermediate term basis, hence I will be trading and trying not to hold stocks for too long.

4.27.2006

OUT OF HERE


NOT EXACTLY BUT YOU GET THE DRIFT- AND BY THE LOOKS OF THE FUTS AND CHINA TALK, LOOKS LIKE A GOOD DAY FOR IT

4.26.2006

DONE


The big news of the day is obviously the flip in the oils from green to red as VLO LSS MVK SWN FTO XTO all get torched. What do they say "the largest corrections come in the middle of bull markets." Never another up day in the oil patch (lol). The metals (+1.5%) are bucking the trend as gold trades back up to the 638 area.

Big Cap tech (QQQQ/SMH) and the Small Caps close flat and market internals close at 400 to the good after being higher by 1,500 in the early morning trade. The SPY closes near the Pivot level of 130.5 after bouncing between there and 131 all day. The tell of the brokers was non telling as they close flat and traded that way all day.

Volatility indexes continue to hover at unchanged levels and offer no new buy or sell signals. Hopefully, anyone who caught my SPY buy signal yesterday, exited the trade with some decent coin. As I have mentioned a few times, I think lower as we probably need more fear before we can lift.

Tomorrow's SPY Pivot looks to be at the 130.65 level with support and resistance around 130.15 and 131 respectively.

I will probably not be posting tomorrow as I need to take care of some personal business. So back late in the day or first thing on Friday.

3:00 AND NOTHING


The SP 500 (SPY) continues to bounce around between it's Pivot (130.5) and resistance level of 131. The internals now show about 500 more winners than losers and I suspect it will get worse before the day is over. The markets have worked off the oversold condition of the last few days and now may again begin a trip lower.

The clues that I look at for hints of future market direction are 1) the techs and the semis, 2) market internals 3) Volatility index levels and 4) the financials/brokers. None of these tells are doing particularly well today even though the much discussed (CNBC) DJIA is plus 67 .

I think the general market (SPY) will have a hard time gaining traction until we see the Volatility Sisters lift. The VIX is still sitting a tad under its 10 day SMA and the VXO is more than 5% below it. Even with the recent crummy action in the QQQQ/SMH, the VXN still sits around 3% below its 10 day SMA.

I am going to wait for the anticipated lower prices to buy and I suspect we may see the 50 day SMA on the SPY (129.5) before the end of the week. That maybe the next stopping point before we get another oversold bounce.

TOOO FUNNY


I was just checking around on some other blogs and my bud Adam came up with this from our bud Barry. It is just too funny.

The markets, well not much too say as the SPY stagnates between the pivot and overhead resistance, the NAZ continues to underwhelm, and the usual areas of interest continue to do just that, Metals and Oils. Buy any and all OIH puts at your risk. Sell OIH puts and its free money (lol).

The market internals are beginning to show signs of doubt as they meander down to 1,000 to the green from the earlier more bullish 1,500 to the green. If you got some winners I say trail them closely, and if you are looking to buy here, well I would not go there except for LSS and MVK, smacked down on LSS earnings and probably a good buy here.

THIS BUDS FOR U

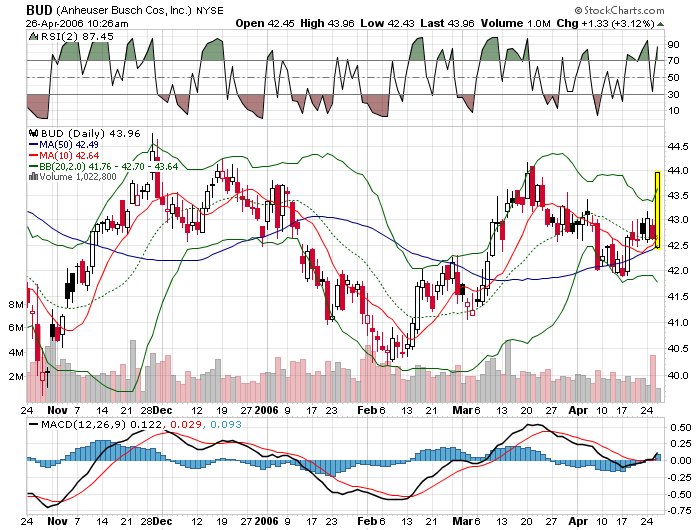
BUD, the beer stock is up almost 5% today after reporting higher earnings, guiding higher and they note that they have "restored beer volume growth momentum." That is good to here and maybe Warren finally has a winner on his hands. The stock has a chart that is straight down since the middle of 2004 and today is it's best day since the beginning of the slide.

Back to trading, the SPY resistance point of 131 has put a lid on the rally so far and I see some troublesome data points. The Semis are lower on the day and the QQQQ is up a whole 5 cents, so big cap tech is not leading today. The market internals are ok with 1,500 issues to the green over red. The brokers have given back much of their early gains and AMZN has turned red. The OIH put sales of yesterday look awfully nice now as the OIH is up about 2%.

The Volatility indexes are a bit pink (bearish) and I would look to lock in profits. This rally is not passing the smell test as of now and if the internals start to turn it could be right back to yesterday's lows. The 10 year Bond at 5.11% is not helping matters and may eventually be the final nail in this rallies coffin.

HEADS UP AGAIN


So the SPY buy yesterday at the 130 level is now about 7 SP points higher in a few hours and anyone who bought should be trailing a stop on the profits. The NYSE internals are looking spry at 850 to the green but the NAZ internals not so good at +280 . And believe it or not the leading sectors today, Oils and Metals, hard to believe. The brokers are also looking good with my boy JEF leading the charge. My other boy, SNDK is also doing well 2% higher.

Its interesting that Tech and Small guys are trailing the leaders today with the Semis and Biotechs red to pink.

The Volatility indexes are heading lower (bearish) and AMZN off the mixed numbers is higher by 25 pennies. GOOG is down a buck and AAPL is higher by 1%,

The Pivot Point today on SPY is 130.47 with resistance at 131 and support at 129.8. If the NYSE internals hang in, I would be inclined to buy a dip back to the pivot area of 130.5.

BLACK GOLD

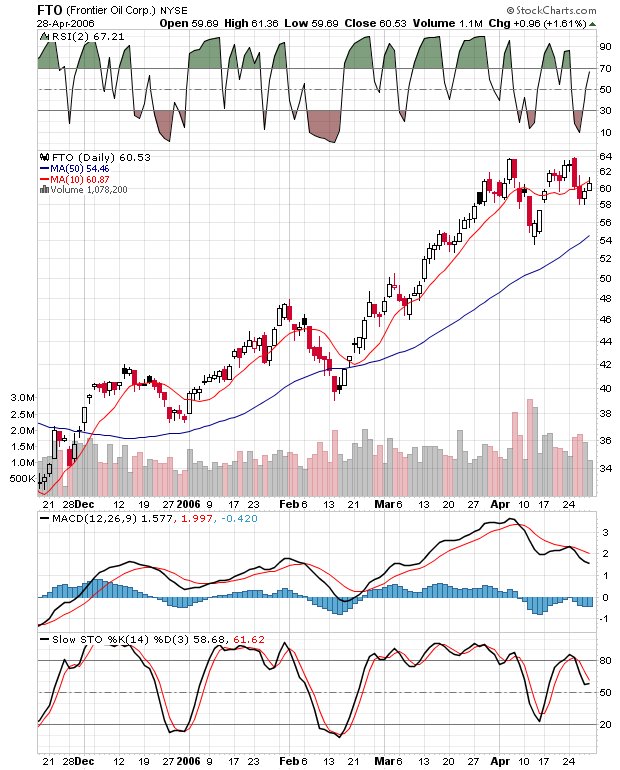
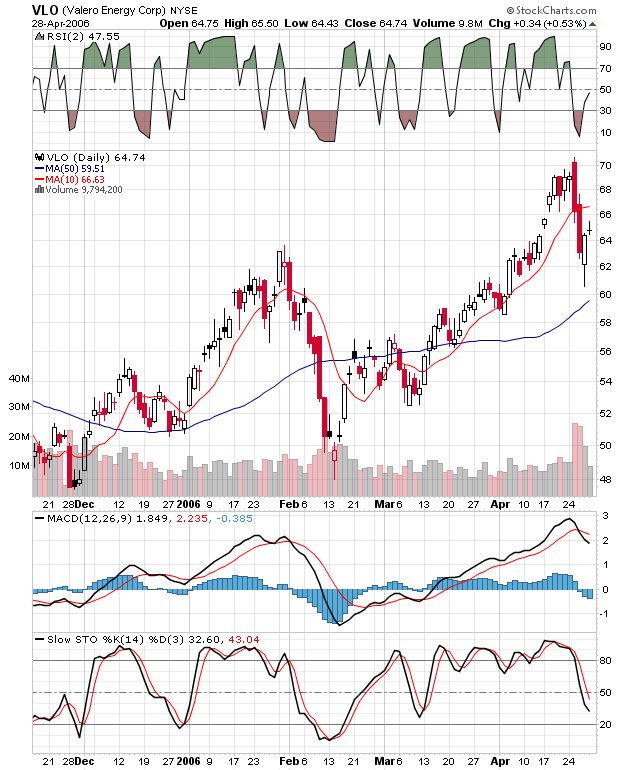
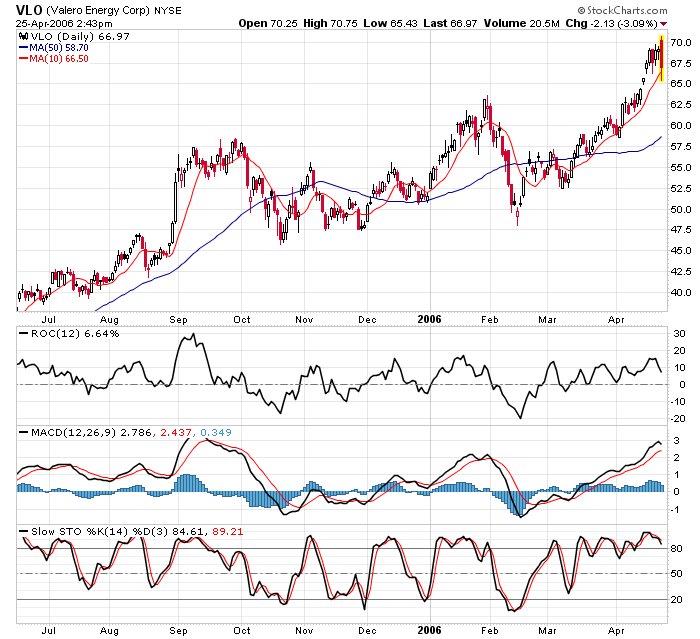
Many traders/investors are holding on to oil shares and wondering where the floor on crude maybe and how high the price of crude could possibly go. Sara Conway, writes her opinion in a terrific article on TradingMarkets.com today and I quote:


"Now that the Crude Oil price has broken out above its range of the year, how high could prices possibly go? One way to calculate a price objective for securities is to measure the range that the security traded in previously, and then project that distance forward from the top of the previous resistance. In the case of the continuous crude contract ($WTIC), the bottom of the previous range in 2006 was at approximately $59.00 and the top was approximately $69.00. The $10.00 difference is then added to $69.00 to obtain a new price objective of $79.00. Once (or if) crude oil prices break above $79.00, a new price objective can be calculated. The contract closed yesterday at approximately $73.33. Is it O.K. to buy (the commodity directly or oil related shares) now or should investors wait for a pullback? To answer this question, it would helpful to know a downside objective in addition to the upside objective of $79.00 that was previously calculated.

An impressive point about this chart is the fact that the break above the prior resistance formed a rising window (or gap). This defines the range even more definitively and likely establishes a new range for the commodity. The gap should serve as support on any decline and also the previous resistance at $69.00 should now serve as new support.Therefore, you could feasibly use any drop below $69.00 on the close as a stop point. In order to calculate a real risk reward, you take the price objective of $79.00 and subtract the current price of $73.33. We have a possible reward of $5.67. Conversely, we have a possible risk of $4.33 ($73.33-$69.00). The reward is greater than the risk, but by only a margin of 1.3 ($5.67/$4.33).

Going long a security with a risk reward ratio of 1.3 is not viewed (by me) as highly aggressive. However, because some of the other tools that can be used to help determine overbought/oversold levels are at the top of their ranges, I would prefer to wait for a little bit of a pullback here. Please notice that since the 19th, the lows of the contract have not gone below approximately $72.65. This could also serve as another piece of support and is likely a good buy in point as well. Put your orders in at slight pullbacks (but not deep retrenchments)."

Bottom line, Sara sees the bottom of the range to be the $70 area (high of the prior range), and a possible top at $79. The rationale certaintly sounds correct and is perfectly logical and there is one other factor going for the longs, a spike due to problems in VEN, Nigeria, Iraq, Iran, Saudi Arabia yadda yadda yadda.

4.25.2006

THERE IT WAS

The markets close near the lows of the day except for the IWM and the QQQQ. Those two indexes brought it back to the flat line while the market internals closed with 1,000 more losers than winners. Keep in mind that IWM/QQQQ/SMH were lagging the SPX during the recent market climb higher. Maybe the lagger now becomes the leader.

The notable losers on the day were the brokers and GOOG. The Semi's turned around and closed green as did the the Precious metals. Volatility indexes didn't budge as the VIX closes at 11.76 and is still a couple of percentage points below its 10 day SMA.

AMZN is out with it's numbers and they look good to the market as the shares are trading up a buck.

On a final note, Liz Ann Sonders on CNBC giving her market commentary. The last meaningful thing I heard from her was about five years ago when she "pounded the table" on BRCD at 150+(today you can get it cheap for $6).

THE OTHER GUY


Revshark on realmoney.com is feeling optimistic about the markets and expects a rally in the tech sector. He says and I quote:

"The market has been attempting a very slow and painful bounce, but forward progress continues to be quite difficult. Despite the action of the last few days, I continue to feel quite positive about the market overall. In fact, I have been telling my young partner that I can't seem to shake the feeling in my bones that we are setting up for a substantial rally in technology stocks.

I believe that concerns about energy prices, interest rates and real estate sales are giving us sufficient negative market sentiment to set the stage for an upward move that catches many folks unprepared. It seems that many people are so focused on how far this market has come since last October that they are convinced that we have to correct at this stage."


The rev usually has a very good market sense and the only thing that bothers me is that he has not been bearish in a long long time. One day we are going to get that 10% correction(always comes), but, just like everyone else, I don't know when.

SIDETRACKED


A bit sidetracked today dealing with some personal issues but I do notice that yesterday's buys of JEF and SNDK are acting quite well.

The SPY support area of 130 has held so far but I am not sure that is going to last through the day. The market internals continue to be troublesome at 1,500 to the red. The Semis are offering a glimmer of hope as they have turned from red to green. Probably not today for the balance of the market but shortly as we are now oversold enough to get a bounce later in the week (tomorrow).

Not sure if anyone is focusing on the 10 year Bond, but it is now over 5.07% and causing some of the markets problems. GS is getting whacked to the tune of 2% today and that one may go on the buy list for later in the week. The other brokers (LM MER BSC) are also taking it on the chin today. The Oils (not VLO) have also come way back as the OIH trades back to almost unchanged after being down more than 3 bucks.

HEADS UP


One of my trading signals just kicked in as the SPY has traded down to the 130 area. The 2 day RSI on the SPY is now under 10 and buying the stock at this level has proven profitable in the past. The IWM and the QQQQ have also attained the same oversold level and are also buyable.

HOWEVER, THIS IS A SHORT TERM TRADE and I SUGGEST SCALING IN.

TRADING W


Just as I get my post market open post up the market tanks as W speaks on Oil and "halts" purchases to the strategic petroleum reserve. He is apparently concerned about his legacy (Terror, Iraq, Iran, Oil prices, Hurricanes, Low approval ratings). But just as he stops talking the markets turn back and recover all the points lost during the speech(lol).

I am not thinking the recovery is going to continue as the market internals (best intraday tell) have not reversed and are still 1,000 issues to the darkside.

Oil seems to be a real battleground today, in light of the speech and VLO numbers and currently the OIH is lower by a buck or .7% after being all over the map this morning. In accordance with full disclosure I sold some OIH 160 puts.

The only other interesting observations this AM are lousy action by the brokers and the 10 year Bond trading up to 5.07%.

10:00 LOOK


The markets have opened lower with the SPY -.36 CENTS, QQQQ -15 CENTS and the IWM -30 CENTS. The market internals have turned red with 900 more declining than advancing issues. Surprisingly(lol), the sectors leading the way today are Oils (+.5%) Metals (2.%). The brokers, one of the stronger groups for the year is down today with GS-.5%, LM-1.3% and MER-.4%. GOOG is down 4.5 bucks.

The 10 year Bond is back to 5.05% and it is bringing down the Reits and the Homies with it. The Volatility indexes continue not to budge (no fear) and I remain on the sidelines with all ETF's as there are no buy/sell signals.

The Pivot Point on the SPY today is the 130.8 level and Support is at 130.5 and 130.1. Resistance is 131.2 and 131.5.

MARKET GRUMBLINGS


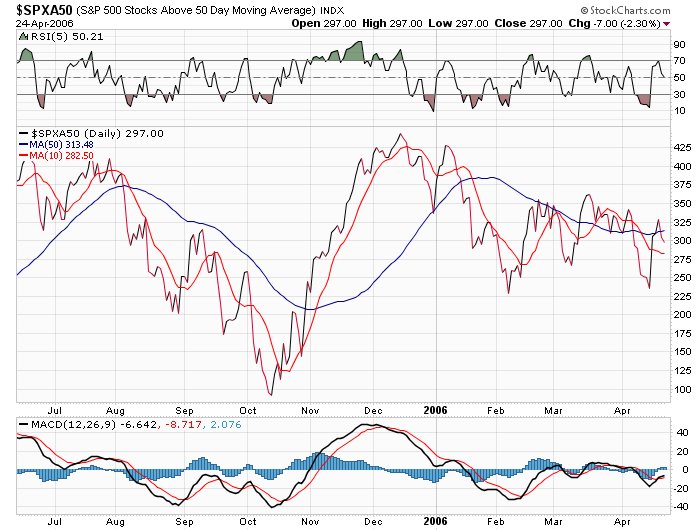
I was reading an article on Tradingmarkets.com earlier this morning about some worries over the recent market breath numbers, so I decided to a little homework. The chart immediately above shows about 320 stocks in the SP500 currently trading above their 50 day SMA. This is in great contrast to back in December of 2005 when the SP500 index was lower and their were over 420 stocks trading above their 50 day SMA. What exactly does this mean? It is an indication that fewer and fewer stocks are participating in the recent market advance ( energy and commodities).

In addition if one looks closely at the SP500 chart, the momentum indicators continue to roll over as the index goes higher. Another sign of an impending market downturn as the momentum indicators are leading and generally forecast a change of direction before it actually happens. This is a clear negative divergence in the SP 500 chart.

MARKET GRUMBLINGS CONTINUED

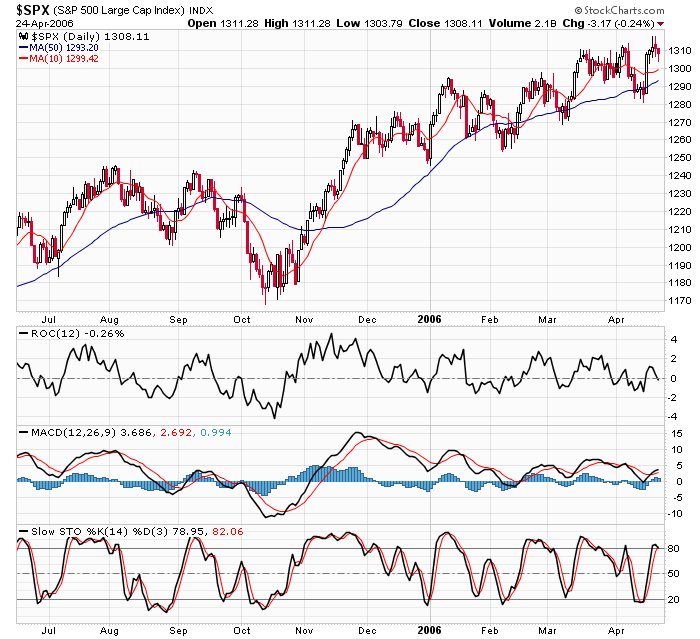
I have thrown in a Rate of Change indicator into this SP500 chart and one can plainly see that it peaked in mid November and has trended steadily lower since even as the SP500 index made new highs. I will not call it an impending disaster, but I will say that the market is running out of momentum as the takeoff from the mid October lows have now run out of steam. The negative divergences on the MACD and the ROC stick out like a soar thumb.

4.24.2006

DISAPPOINTMENT


The VXO went straight down today after opening at 11.4 it closed at near the low of the day at 10.43 which is about 8% below its 10 day SMA. We know from past history that the markets have problems making northbound progress when the VIX/VXO indexes are more than 5% below their 10 day SMA's. The 2 day RSI on the VXO is also at the very oversold level of 12. This is disappointing news as the VXO should have risen today as the markets sold went lower.

THE CLOSE


The markets closed near where they opened with the SP down 3 and the NAZ down 9. The other NAZ the 100 or QQQQ closed down a nickel. The big losers on the day were the Oil stocks as the OIH closed down 2.31 or 1.4%.

The market internals hinted all day that the market was not gonna flip to the green as they remained red by at least 1,500 issues through out the day. The 10 year Bond closed back under 5% and GOOG closed up 3.4.

The Volatility indexes closed about unchanged and continue to give no new buy or sell signals. The 2 day RSI on the SPY is "down" to 45 indicating it is trading in the middle of its recent range( no signal). IWM and QQQQ are closer to buy signals with 2 day RSI ratings of approximately 20. Maybe tomorrow we get some actionable signals.

THE "REALMONEY" CROWD

I just don't get it. Jim Cramer writes this morning when the SP500 was down about 4 and the QQQQ was down about a dime a column called "Today We Take Our Lumps" and in the blog he says "Nasty, isn't it? But can we stipulate that we were up huge last week and that we are, alas, somewhat due, given that the macro environment is as bad as the micro is good?" Since Jimmy penned that column, the markets have turned all the way around and the SPY is now down only 17 cents, up from down 40 cents, and the QQQQ has now turned higher on the day.

Revshark on the same realmoney site penned a column called "Its In the Charts" at 2:15 where he says " I particularly like many of the charts I'm seeing in the technology group and believe all we need is a little patience before they set up and start moving higher. So while many are becoming increasingly worried and concerned, I'm sitting and waiting patiently while we once again are treated to another bout of negativity."

Negativity- What negativity- What do these guys see that I am missing. There is no negativity, the VIX is now up .11 on the day and trades at 11.69, the DJIA is up on the day and the SP500 is down 1.5 points.

Maybe its been so long since we have seen any dramatic selling that we have grown immune and any day that is not an up day is "negative and lousy."

OIL TRADE


The OIH is trading down over 3 bucks today and I am wondering if its too late to sell or too early to buy(lol). Stocks like VLO FTO and HOC should start to see their earnings estimates get ramped up in light of the higher crude prices. Stocks like SLB HAL RIG etc should also see earnings growth ramp as more rigs and services are needed too find more expensive oil. I believe that we will see the near term highs on OIL when we get some sort of shock spiking the price north of $80/90 (IRAN IRAQ VEN NIGERIA, your choice). Until then, my plan is too buy pullbacks or short puts. One more day of selling (probably tomorrow) and I will begin to buy the dip.

BLOGGER WORKING


Blogger is finally back working and I will stand by what I posted at 8:30 this morning. Markets are in pullback mode as the internals remain at 2k to the red. I put a picture of the gold up cause it looked like it was turning up on the day but now back to red.

I have purchased SNDK XTO and JEF and am not expecting to buy ETF's until the markets pullback further. Other stocks that look interesting on the pullback include GWR and GRP.

TECHNICALS - SPY

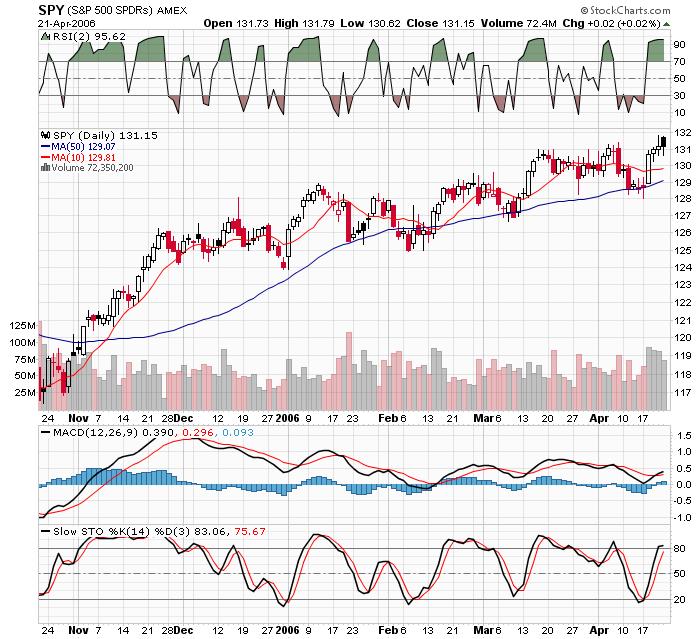
This morning we find the SPY trading at around 131 with the Pivot Point right back at the 131.2 level with Initial Resistance at 131.75 and First Support at 130.6.

The VIX is 4% below its 10 day SMA and the VXO is about 7% below its 10 day SMA. The 2 day RSI is at 96 so the bottom line is that the market continues to trade at the upper end of its recent trading range and is due for a pullback into the 129's.

It is also interesting that the 50 day SMA on the SPY is at about the 129.5 level so that may be a short term pullback target.

The NAZDAQ indexes have been underperforming and that may also be signaling a near term top in the big cap indexes. The 2 day RSI on both the QQQQ and the NAZ COMP is in the 20's making their recent underperformance very identifiable.