6.17.2006
THE ROUNDTABLE

Great news this Saturday morning, Alan Abelson is back at his desk at Barron's and the roundtable gang is making some picks. Here we go:
John Neff:
C LYO YRCW DHI
Fred Hickey:
NEM
Short OVTI
Bill Gross:
EFA BGT PMF
Mark Faber:
Singaport RE Trusts (SUN SP) (MMP SP) ROJANA TB TICON TB
Gold under $580
Short Copper @3.2 per lb
Scott Black:
ARW ANF
Felix Zulauf:
3 Month Treasuries
Oscar Schafer:
KOSP DRC
Abby Joseph Cohen (?)
MRVL EBAY QCOM
Meryl Witmer:
CHAP MEG MWA
Mario (I settled) Gabelli:
CSG TRB LCAPA TG
Archie MacAllister:
SVU JBLU DRL
6.16.2006
THE FINAL

The close is in and not surprisingly, the DJIA closed down less than a point and the SPX was down 4.5. NAZ was the worst, down 14 and the internals looked more like the NAZ as there were more than 1,900 more losers than winners.
The news of the day is actually the Cramer article as there has been lots written. My pal Adam has written the best I have seen and I suggest everyone check it out here. Cramer remains a hazard to folks financial health, so please, if you buy one of his picks, do your homework and never buy it when he recommends it. In my opinion, he remains the guy pictured.
CHOP CHOP
Interestingly Gold and Silver are higher but the mining indexes are somewhat lower. Oils are trying to make a run to the flatline and finally getting to it.
The 10 year Bond is back over the 5.12% line and the brokers are starting to get some jig into the close as GS LM and LEH all turn green.
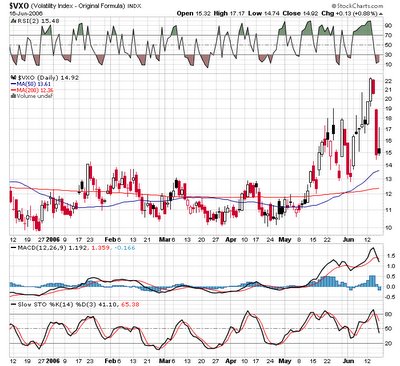
The VIX is outramping the VXO with the former up 6% and the latter up 2.5%.
Lots of folks have emailed me this article, as the mad monkey is finally getting his just due. Just surprised it took so long for the non bloggers to get it.
LACK OF POSTS

The posts will be few and far between today as I don't expect much market movement, and I need some down time in light of the past weeks action.
Also, the US open is down the road at Winged Foot and that will be the focus of the day. My guy Phil teeing off later this afternoon and I would love to see him win three in a row after all the talk of "when will Phil win his first major."
Major market indexes in the red and I bet the bulls are kind of happy to see a little digestion today, although not too much. I would not be surprised to see the market make some headway this afternoon as some folks like the idea of buying this little pullback.
Biggest losers are the metals and oil and is that INTC green again, yes, it is now up for the fourth day in a row after bottoming at the 16.75 area.
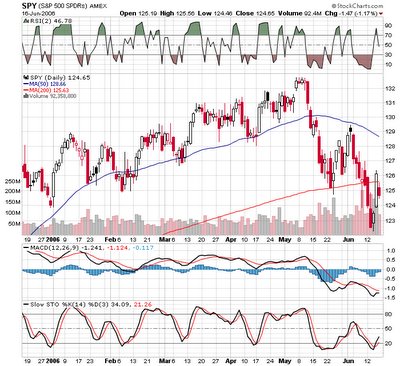
Also note how the DIA and the SPX have bounced from their Pivot Points. SPY pivot not going to work as it had its dividend today.
OPENING LOOK

The major market indexes are unchanged as I type, although the market internals show 1,300 more losers than winners. Sectors outperforming include drugs, some techs and retailers. Metals oils and brokers are underperforming, but I would call the action basically choppy.
T Boone on Bloomberg predicting $80 oil before the end of the year. He has been correct before on oil prices and I bet (long oil shares) he will be correct again with this predicition.
BULLISH ARMS

Dick Arms' column on realmoney.com just up and he is bullish for a trade. Here is what he says:
"The very oversold condition we were looking at last week and going into this week has led to a spectacular and very rapid advance in the last two days. Such an advance was to be expected, if only because we were so oversold according to the Arms Index numbers. Now, after regaining part of the decline that started back in May, the question is whether it is just a relief rally or something that has further to go. "
"Actually, I think it is both. The relief rally is apparent. But we are still quite oversold by most measurements. The move probably has gone too far too fast, so some resting, at least, over the next few sessions is likely. But after such a big decline and with such extremes being reached in my indicators, I feel the rally will, after a rest, push further."
" In the last two days, two very bullish numbers -- Thursday's was one of the most bullish numbers in history -- have entered the series, pushing the five-day well away from its extreme of just the day before. On the other hand, the 10-day is still very near the extremes. And the 21-day (not shown here), which I use for longer-term projections, is at its most oversold in two years. "
"My conclusion is that there is going to be more on the upside, but perhaps some hesitation first. Therefore, if you have not already gone long because of the extreme oversold condition of last week, a strategy might be to wait a bit, but buy on a pullback. "
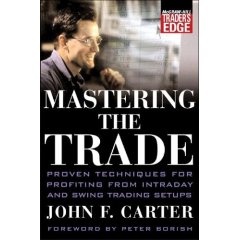
That sounds like a good strategy, especially with the gap down we are looking at in the SP Futures this morning. I think this gap will get bought (78% chance of gap fills on Fridays per Carter) and then we probably meander near the unchanged line for most of the day.
ATTENTION ALL HOME GAMERS

Thought it was time to update the Mad Money stock picking record as computed by booyahboy audit, the original Jim Cramer tracking site.
The highlights are that Jim's picks are up 2.7%, the DJIA is up 2.9% and the SPX is up 1%. According to the site, Jimmy has now picked 844 stocks and commissions/transaction costs/taxes/ and most importantly the value of your time and sanity, are not included in the computations. The methodology on the site is to use the 4:00 PM close for the prices of any stock picks which are made after 4, so any price increase in the afterhours is a free gain, very similar to my GS trade from yesterday (lol) where the price gapped $2.5 bucks on the open. Isn't it surprising that Jim can't beat the DJIA, a price weighted group of 30 old line stocks, even with the gap advantage.
6.15.2006
AMAZING DAY
 An amazing day with the SPX having its biggest one day gain since October of 2003 or 986 calendar days according to our friends at Ticker Sense. Can it continue?
I don't know, but I do know that the there is a gap on the SPX from today's open that will eventually get filled, that all the volatility indexes got crushed today and all now trade about 15% below their 10 day SMA's and we know that as a general rule the markets rarely get traction when the Volatility indexes are this oversold.
I also know that all the oversold indicators failed to help on the way down as the buy signals kept on coming and the markets kept on falling. Time will tell if its different this time with the sell signals as well.
RAINING ON THE PARADE
 Everyone is bullish and excited and feels a heck of a lot better than they did on Tuesday when we had the Sonders bottom. Well, not so fast as we now have this huge gap to fill on the VXO and the opening gap to fill on the SPX. In addition, we have the SPX back at the 200 day SMA and the 2 day RSI back at the overbought 85 level. One other thing, the VXO is now 15% below its 10 day SMA. Pretty amazing how fast we go from dismay and disbelief to euphoria.
The TRIN is down to .22 and I can't remember the last time I saw it there, but the general rule is if the TRIN closes below .6, the chances are about 80% that the markets will sell off the next day. Of course it was only a few days ago that the TRIN was at 2.83 and that did't work as a buy signal so we will have to wait and see. FUN FUN FUN.
TECHNICALS - OIH
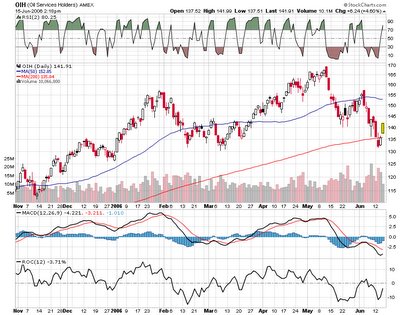
Not unlike most other charts, the OIH has also us up with a bullish divergence as the price made a lower low but the MACD Histogram and ROC momentum indicators made higher lows.
One pal (Jim) called me on Tuesday midday with the "I can't take the pain anymore" and he rang the bottom bell on the OIH, which he wanted to sell, which have ripped higher with the rest of the oil patch and equities in general.
From a trading viewpoint, it looks like the OIH could rip into the 50 day SMA area (155) with a logical stop just under the recent lows.
AFTERNOON LOOK

Markets continue higher this afternoon although considerably off their highs. Note the old adage "markets that are strong all day tend to close at their highs." Another adage, "if the markets pull back and the internals remain strong, buy the pullback."
Well nothing in trading is a sure bet but things look pretty good for another rally into the end of the day as the internals remain strong with 3,300 more winners than losers.
Winning sectors continue to be small caps, brokers, homies, oils and metals. Losers are MSFT EBAY MDT and WFC. I expect the markets to ramp up again this afternoon as the buy the dippers throw in the towel and buy near the close.
Bernanke on the tape giving the market some more ammo as he says he expects energy prices to be manageable and that energy and commodity prices might have caused recent uptick in inflation. Not real earth shattering stuff, but its better than saying we are worried about inflation.
The other problem with today, too many sports as US Open, Mets and Yanks all on the same time. Channel Hopping?
CRUSHED VOLATILITY
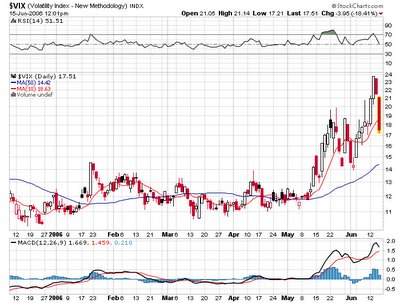 Just like that the correction and the fear are a distant memory as the VIX loses 20% and is back under its 10 day SMA.
GS mentioned before the open is up 4 beaners and like other sites I will put it on the sheets at 138+ and count the opening pop as part of the gains (lol).
The market internals continue to act great as there are more than 3,500 more winners than losers and I can hear the "thank goodness we didn't crash" sound from coast to coast.
IWM still leading the pack higher with the oils, metals, semis, brokers and homies. Interesting that homies are jiggy in the face of downgrades and the 10 year Bond back at 5.1%. Not sure why unless the worst has been discounted.
The markets are not giving the "buy the dip" crowd much of a chance to get in so we probably close at the highs as the late bulls throw in the towel and hit any bid late in the day.
RINGING THE BELL?

They don't ring a bell at the bottom or at the top but it looks like those that bought yesterday and Tuesday are sitting pretty.
The market internals are acting better than they have in a long long time with about 3,500 more winners than losers.
The SPX gapped higher on the open and has yet to look back. The best performer of the major ETF's is IWM up 1.8% and the sector outperformers include metals, oils, semis and brokers. My GS pick is looking great as it is up 3 but unfortunately it gapped without me and I will look to buy a pullback. And how come Pisani doesn't mention that "we don't want to see this market led by oils and metals." I guess he will take what he can get.
The volatility indexes have all gapped down 8 or 9 percent so stay focused as I expect lots of volatility.
TECHNICALS -GS
 If the scenario plays out and the markets have put in the Sonders bottom, it is unlikely that the markets will move higher without GS participating. It is now trading at its 200 day SMA and has bullish divergences on its MACD Historgram and Rate of Change indicators. Earnings estimates for this this year are almost $15 yielding a PE ratio of under 10. The obvious question, will the earnings and trading profits keep up under different market conditions and how will the pending sales of Hank's stock impact the price. My guess is if the market goes up this equity also goes up. This equity also appears to be a good risk to reward ratio and I anticipate stepping up to it. Besides Jimmy liked it at 160 back in April when he gave it a 225 target based on a $15 eps and a 15x multiple. I will be happy to sell it where he bulled it.
GOOD STUFF

Some facts for the morning:
SPX futures are trading up about 5 as I type and that would put the SPY right at daily resistance of 124- note the pivot point today is 123, so a filling of the gap (or close) may be a good time to get long-
The VIX is back down to 21.46 after reaching a multi year high on Tuesday, is now stretched 17% above its 10 day SMA.
Under 20% of the SPX components are trading under their 50 day SMA's which is the approximate level of previous market bottoms.
Charles from The Kirk Report has dipped in his toe for an index trade and he has been great avoiding the rush.
Risk to reward on a swing index ETF trade may be staring at us as we now have a good stop out point- (Tuesday's lows), and a good target area of the 200 day SMA (SPY 126). DIA may even be a better vehicle as the real big guys may be the place for the first significant bounce.
Paul Hickey at Ticker Sense notes the following from David Rosenberg at ML:
1) The markets have gone about 820 sessions without a 10% correction so we have been overdue for a pullback.
2) The forward P/E has compressed to a mere 14.1x, back to the area where it was in Oct 2005, where the market bottomed.
3) Earnings remain strong and inflation fears seem to be subsiding as commodities pullback.
6.14.2006
SAME OLD STORY

The chart looks the same after today's bounce as the Bullish Divergence remains in place on the MACD Histogram and the Rate of Change indicators. The rehash, lower levels on the price of the SPX and higher lows on the MACD Histogram and Rate of Change indicators. I want more evidence and any bounce up to the 1260 area will be sold big time by everyone in my humble humble opinion. However, lets get there first.
CLOSING AT THE HIGHS

Markets are closing at the highs is the good news, the bad news, on this day where the DJIA is closing +100, the internals are 400 to the green meaning ordinary stocks are barely participating. The DJIA shows 25 up and 5 down so this is plainly a blue chip rally that probably will not last. This is one reason to own index funds over individual stocks.
The sector winners were small caps, oils, metals and semis. Losers were the financials, internets and brokers.
Very appropriate that there is hardly a mention of the nonconfirming internals on taut tv.
LONG TERM PERSPECTIVE

Since the markets are having starts and stops today and I am not trading it, I wanted to put in a little rant.
Sooner or later oil will be in tighter and tighter supply and eventually we will be left without any crude but we will have plenty of holes in the ground. It will happen, the only question is when, 50 years, 100 years or 200 years but it will happen. What is the point of pretending that the solution is to try to find more oil?
During the dry out period, the price of oil will creep higher and we will continue to send more and more of our wealth to the countries long oil. Our economy and living standards will suffer and the folks in the middle east will benefit as the wealth is transferred.
My point is that we need to face the truth and the inevitable consequence of a diminishing supply of oil. Face the fact that it is running out and it will eventually be dry. It doesn't matter if its next year or in 200 years, we need a different energy source. If we don't do it sooner rather than later our living standards and economy will suffer dramatically.
OVERSOLD RALLY NEVER COMES

The markets refuse to rally on any sustainable basis as the market internals (told ya) flip back to 1,200 to the red. The financials also a pretty good tell as the markets generally have a hard time rallying with those equities in the green.
Metals and oils are green but well off their highs as are the upgraded semis.
Could this be the final washout? SURE- On another note- I bet one of these 2 guys wins on sunday.
NOON UPDATE

Markets continue to meander higher but no great buying pressure yet. Market internals are a pathetic 500 to the green clearly showing the uninspiring move.
Sector outperformers include oils, metals and small caps; trailing sectors are internets and financials and if they don't tick up this rally probably fail by 2:00 eastern time.
Homies got a bounce on the news of the value buyers but it is also failing, however, value buyers have the distinct advantage of being early on their trades.
Semis are higher with some tech but overall just blah action.
The question remains; did the markets sell off on inflation and rate hike news or is the economy rapidly slowing and will the rate hikes that fight inflation bring the economy down? And how about that Ticker Sense chart on inflation ramping out of control.
BAD BLOGGER
SPY could not stay over its pivot point of 123.3 so now faders have come in to knock the market back down.
I guess the high probability trade is to fade any strength but with the way way oversold conditions I will work on some research/projects.
MORNING VIEWS
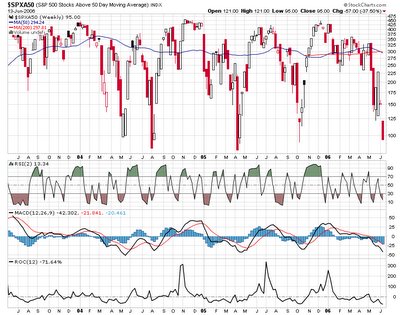
The morning trade will be interesting as more inflation data points appear for the Fed Heads to absorb. Futures are flying higher off the potential Liz Ann Sonders "flight to cash" bottom from yesterday.
Semis get upgraded by Goldie and Investor's Intelligence survey finds a drop in bullish sentiment to 38.7% from 40.2% and a rise in bearish sentiment to 34.4% from 31.5%. These are the lowest bullish readings since Oct 2002 and highest bearish reading since April of 2003. October of 2002 was the bottom in the market when the SPX hit 800. More food?
The chart above shows that as of last night's close, more than 80% of the SPX stocks are trading below their 50 day SMA. Similar stats at other market bottoms such as April 05, October 05 and August of 04.
On a final note, if inflation were the driving force behind this market decline, bond rates would be higher and commodities would not have crash landed. Hey Bennie, worry about a recession from higher rates please. Thanks much.
6.13.2006
PRETTY VOLATILITY

One of the best looking wall street strategists, Liz Ann Sonders, has just suggested on CNBC that investors switch to Cash and abandon the stock ship. Now, my only recollection of anything meaningful that Liz did, was to suggest buying BRCD in Y2K at $150. That did not work out that well for the longs and I suspect this one will work the same.
As I write, the SP500 futures have climbed over 10 points in the few minutes since Liz Ann made her comments. As I said earlier today, the TV strategists that I hear on CNBC/Bloomberg are all turning bearish, looking for a long bear market. Some of the smarter folks on the street are looking at opportunity as they realize that a lot of the selling is forced margin calls.
One interesting chart worth checking is this one from TickerSense. Very Interesting.
NOT SO PRECIOUS
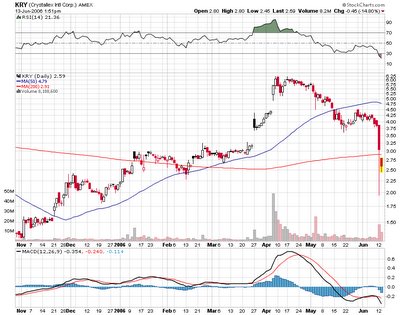 Usually, I don't like to hit a guy when he is crawling on the floor, but this KRY is just awful along with all the metal stocks. Jimmy could not have made a worse call then he did with this column on May 9th where he declared that "not only is there a gold shortage, but more acutely, there is a shortage of gold stocks." Jimmy liked the idea of KRY, the difference between KRY and some of the others is that if you owned GG, PAAS or SSRI the chances are good that the stocks will do fine if the metals go higher. KRY will never come back unless Cramer or a new Cramer touts it on CNBC and I am not sure if even Jimmy has the stomach to go back and bull a thinly traded AMEX mining stock located in Venezuela.
Revshark over on realmoney.com makes a great point today that this is one of the worst market periods he has seen in all the years he has been trading. The reason being that there are no bounces that allow one to sell out of bad positions. I am quite certain that before long we will have a significant bounce, however, I also suspect that we may see a major blow up in the hedge fund/investment community before long.
Still not quite confident of where the roulette wheel will land this afternoon although red is looking more and more like a safe bet.
DEAD BULL

I have recently switched away from CNBC to Bloomberg as I find there interviews better and the folks they interview better and less celeb type. Just about all of them are now bearish and expecting declines to last for up to 18 months. Not sure if this is a great contra indicator but I have heard worse.
David Winters, who used to run some of the Mutual Series funds and now has his own fund, is upcoming on Bloomberg and I am very curious to hear his take as I find him to be one of the best.
The market internals started today being 2k red improved to 1k green went back to 2k red and are now at 1k red so if you like volatility in your markets, today is one of your days.
The OIH is also all over the board today along with the major market indexes as it hovers between down 3 and up 2. It is still fairly early in the day and I have no idea if the arrow will land on red or green.
Volatility indexes are fairly flat and the VIX/VXO duo is currently trading at a bit under 120% of their 10 day SMA.
Metals are crushed, oils are now higher, small caps are outperforming, semis have been up most of the day and most of the DJIA components (19) are higher. INTC and MRK are the DJIA leaders and MO and DIS are the biggest DJIA losers on the day.
OPENING LOOK
The oils have also flipped to the green as the OIH started the day down 2.5 and is now higher by 1.5 and the story of the day is MVK is at is be taking out with a 40% premium. MVK was mentioned as a long candidate several weeks ago at higher prices of course but now the trade is looking better. All of the MVK type companies including my favorite LSS are trading cheap and more deals/ higher prices in this space would not surprise me.
6.12.2006
TECHNICALS- IWM
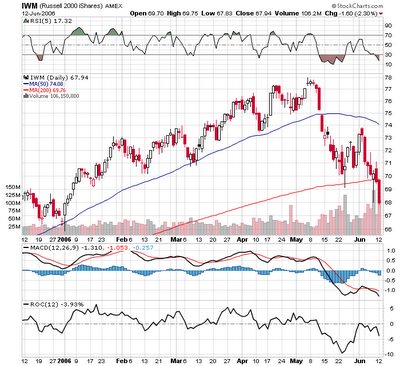
Relentless selling of the small caps continues in spite of the Bullish Divergence on the ROC and MACD Histogram indicators.
I have no clue when/why the selling will stop but then again I didn't see a major selloff coming. One thought, maybe as soon as Big Ben comes out with his June fed decision the market will surprise us and turn around especially if he has something to say that investors like such as a hint that they are done raising rates.
FORGET TRADING NOW

Jimmy talking today some tech nonsense as he says he hears some trading desks say to switch out of wireless and into PC stocks. Sounds like a home run trade from here; he totally ignores his favorite Venezuelan gold stock, KRY. I guess that is one where he can't tell folks to sell as there will be no bids.
Looks like another day where we close at or near the lows and the oversold conditions become more and more meaningless as the relentless downtrend continues. The down/up volume is running at almost 10/1 to the downside but that has been meaningless. The VIX has traded up to 21 and is now 20% above its 10 day SMA and that has also been meaningless. As long as these markets trade under the 200 day SMA, I will continue to stand aside and wait for better opportunities on anything but a quick day trade.
MORE SELLING

This market refuses to let traders out of long positions as it continues to accelerate lower and the only green on the screens are the Volatility indexes, the 10 year Bond and MSFT. Oh and GM up almost 3%.
Also wondering what Jimmy will be telling us about KRY this afternoon. Its going be tough to tell folks to sell now as who exactly is going to be buying?
The TRIN is back near the 2.00 level indicating way oversold on the day and up to down volume is 215M up and 910M down- so ugly and not sure how long it can continue.
Market internals 3,000 more losers than winner and Art Cashen, one of the best on the street is still not expecting a rally. The final hour of trading will sure be interesting. And for anyone who can't bear to watch the screens, here is another terrific list of random links from Captain Kirk.
TECHNICALS -KRY
 Congratulations to all of the folks who decided not to buy the KRY recommendation from the carnival barker. Please note the homework from back in early April when Cramer bulled it. Note the headlines as the stock drops 35% and fills all the open gaps:
"Venezuela may seek a majority control in mining ventures under proposed changes to the country's laws regulating the extraction of gold and other minerals."
1:00 UPDATER
Major market indexes continue to trade near their flatlines with the DJIA being the best performer with 18 issues higher than 12 lower.
The rest of the market is not doing nearly as well as there are more than 2,000 shares lower than higher. Bad but an improvement over the worst levels of the day when there were 3,000 more issues lower than higher.
The brokers continue to get hammered with LM now only up slightly and others such as GS LEH MS and MER all trading poorly. The only sector green is the DRUG group and that is no big time gainer.
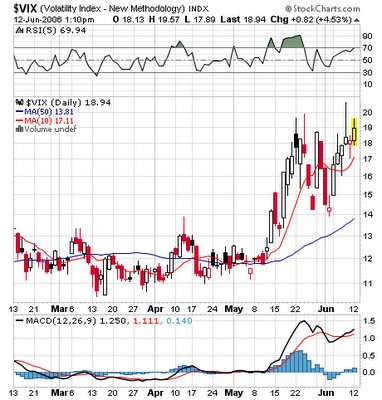
The VIX is higher by 5% and is trading above the "not so magic" 110% of the 10 day SMA level.
If this market gets going today, the tell will be the market internals and that is where I will be focusing.
Did I mention that the 5 day SMA of the TRIN is now the highest number it has been since October of 2004, nah, it doesn't matter.
ANOTHER VIEW
The markets continue to be very volatile as the morning strength was immediately sold. The market internals told the story as they never confirmed the early index strength.
However, some interesting morning commentary from the terrific Raymond James strategist
Jeff Saut and republished at minyanville.com:
"Well, it is day 22 in the envisioned 17- to 25-session selling-squall and we think the equity markets are attempting to bottom. By our pencil the Federal Reserve news is past its emotional bearish-peak given Ben Bernanke’s “Dr. Jekyll / Mr. Hyde” switcheroo (aka, dove to hawk). That sense was reinforced last week when the 20-year T’Bond broke out to the upside, suggesting lower interest rates. As well, we think the geopolitical emotional bearish-peak is behind us with the “let’s make friends” Iranian proposal, combined with the Zarqawi “bombshell,” so the only item left in the typical bottoming sequence is a “body” . . . hello Long Term Capital Management! Hopefully a “body” will surface this week concurrent with either a successful retest of last week’s lows (SPX 1235; DJIA 10757; NDX 1526; etc.), or even better, lower lows driven by MUCH higher than expected inflation figures this week. In any event, like last October, we have pulled our “buy list” together and are pretty “thrilled” about being able to become an aggressive buyer of stocks again after being pretty cautious since mid-January."
Jeff also had the this little tidbit:
"If inflation worries are the causa proxima for the equity markets’ demise, why are commodities crashing (inflation should be good for commodities) and why are bonds (TLT) rallying (inflation should be bad for bonds)?”
My take is simple. I prefer to trade on Jeff's side.
OPENING PEAK

The markets open slightly higher with the large caps taking the lead as the DJIA is 20 points higher, the SPX 2 higher and the IWM and the NAZ both slightly lower.
Market internals show about 1,000 more losers than winners but the DJ stocks show 26 of the 30 higher led by GM AA MRK INTC MO and XOM; losers include HD and DIS.
Sectors outperforming include drugs, metals and oils with the losers being small caps, finanicals and homies.
The major brokers are reporting earnings this week and LEH had good numbers this morning but is selling off on the news. LM was bulled in barron and is trading up 3% and GS, also reporting this week, is trading down a buck.
PRE OPEN LOOK
 I mentioned last night about the selloff in the last few minutes of trading on Friday and now it looks like it will reverse back up on the open as the SP futures are up by 4.5 points. Also, keep in mind that Monday's are the worst day for gap fill trades according to John Carter of Mastering The Trade.
The pivot points on the SPY is 125.9 which also approximates the weekly pivot of 126. Daily resistance is 126.5 and support is 124.75.
6.11.2006
WHATS UP
 The bullish divergence trade still speaking pretty loudly on the SPX as the indexes continue to trade lower and the MOMO indicators remain higher and what was that selloff in the last 10 minutes on Friday?
Anyhow, here are some great random links starting with BarryR., going to Adam W., Ron Sen and Captain Kirk.

