6.02.2006

STOP TRADING FOR THE WEEK


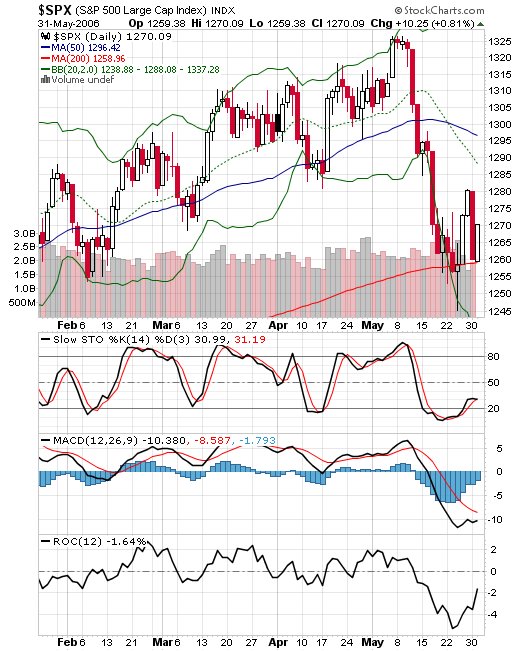
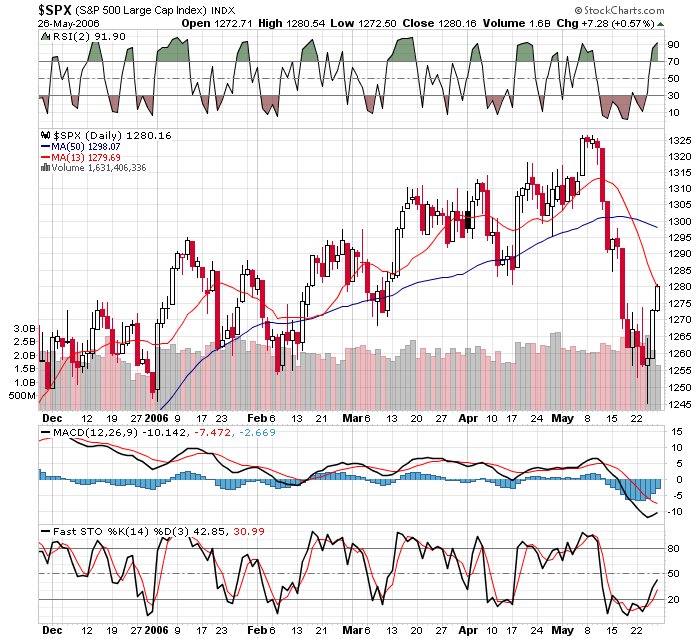
It looks like the NYSE internals were a pretty good tell as the market gets some jig this afternoon and it may yet close near the highs. What happened to the Iran problem? Is it solved already or did the market trade on some other metric (lol).

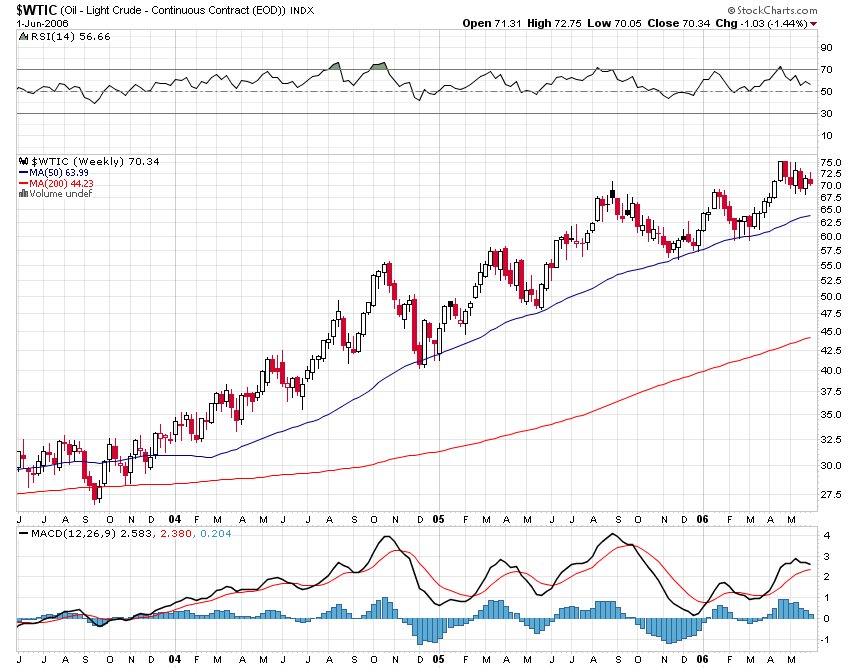
Everyone's favorite Oil stock is acting quite well including VLO FTO NOV and HP. Are we back to the selling OIH puts mode? Probably, but I will wait for some lower prices as some of the puts I sold a few weeks ago are going worhthless. Hopefully, they stay worthless this time.

How about that Cramer, bullish on COH and KMB and bearish on MOV and PG and of course he still loves UNH which is probably ok for the longer term when ever that is.

AFTERNOON PEAK

The markets continue to trade in a narrow afternoon range with the SPX close to unchanged, the NAZ down about 6 and the DJIA the worst performer, down 35 on the heels of IBM WMT and CAT underperforming.

The feather in the bulls cap remains the NYSE internals as they continue to trade with more than 800 winners over losers.

Therefore, I expect a good chance (60%) of another ramp into the late afternoon trade.

Sectors doing the best include Oil / metals and financials with the laggards being tech, semis and homies and how bout that 10 year Bond now trading under 5%.

AMUSEMENT


Just as I heard Melissa Lee on CNBC tell me how the markets are selling off because crude is going higher I decided I would check out the negative correlation between crude and the SPX. I don't think I need to add much commentary to that picture (1,000 words)?

By the way, the SPY pivot point hit at 128.3 and the futures have climbed 4 points since. And is that a negative divergence I see on crude? Yes.

LOOK OVER HERE


The markets have shrugged off the news from Iran and are trading higher on the Fed/EMPLOYMENT news, well I really don't know that for sure and neither does anyone else but that appears to be the case.

And while the SPY Pivot never was hit the DIA pivot was and I bought and I sold and I am still hanging on to some with my stop back at break even.

And for those looking for some kind of technique or daytrading methodology, John Carter spells out a nice one in his book mentioned yesterday:

Buy a bit above the Pivot Point if you think the mkt is in uptrend with a target of twenty cents and a stop of thirty cents.

Short a bit below the Pivot Point if you think the mkt is in a downtrend with the same targets as above.

The best tell to which way the market is going? Market internals and Brokers and note this morning the NYSE internals never gave it back as the markets pulled back.

Also note the continued trashing of the Volatility indexes. I am pretty sure I will be closing out my longer term ETF longs into any afternoon ramp.

OPENING LOOK


That was quick as the SPY opened right at its daily resistance of 129.35 and has since sold off on word of more Iran problems. Not sure that is the reason for the as the Iran news was known before the markets opened while the futures were ramping.

The Pivot Point today is 128.3 and yesterday's pivot was not hit so there is a very high liklihood that todays will and that means more downside action.

The NYSE internals are still fairly positive as there are 700 more winners than losers and the NAZ internals are flat. Winning sectors are Metals and oils and the losers are tech, retail, consumer and homie.

The 10 year Bond is back to 5.02% so don't be surprised if we here about a trade of out of bonds and into equities.

BAD IS GOOD AND GOOD IS BAD


So the job numbers came in at +75K and everyone is all excited and the futures are ramping higher. Why? Well the number was supposed to be +170K and maybe the economy is slowing and the FED is now done since there motto is "we are data dependent." And where was Larry this morning?

So it looks like the motto of the day will be "the fed is done" but keep in mind that next week more numbers will come out that may show a strong economy or high inflation and the motto will change to "only 1 or 2 more raises." That is what makes markets and makes happy traders.

Keep in mind that on a relative basis the markets are quite overbought especially this morning with the latest ramp. Shorts who decided to short the rally after the recent sell off are going to be stopped out this morning causing additional fire power. This is one of the reasons that shorting stocks is so difficult and why as a general rule I do not recommend it and don't do it except on a very short term basis.

6.01.2006

SELL SIGNALS AND SCALING OUT-


So everyone is all excited about the markets again as the DJIA blasts off 92 points higher and the NAZ, the big winner on the day lifts 41 points. Market internals did confirm as they close with 3,100 more winning stocks than losers.

Sector winners include the Small caps, Techs, Biotechs, Semis, Retailers, Defense, Cyclicals and Drugs so just about everything except the metals and the oils flatlined.

The problem is we are overbought again on an advance/decline basis and the Volatility indexes have been crushed and they are screaming sell as the duo (VIX/VXO) trade way below their 10 day SMA's.

Buy programs started in the morning and kept going all day long as the TICK continuously hit the 1,200 and higher number so maybe there was lots of money coming in for the beginning of the month in spite of all the new bearish sentiment.

One has to wonder when Maria, Bob, Mark and the gang begin to ask the question again - Will the DJIA make a new all time high today? And how about Cramer with a new soft landing theory?

HEADS UP

I am selling some of my index longs here as some sell signals are kicking in. The SPY has retraced about half its losses from the bird flu low and the QQQQ looks like it has plenty of overhead resistance. The Volatility indexes are also flashing sell signs as the VIX/VXO indexes are both stretched 10% from their 10 day SMA's.

Better to sell to early than too late?

The winning index on the day is the QQQQ after having an awful month of May, maybe Tech and Biotech is back. At least for the day, as the QQQQ is up over 1.5% compared with even the IWM, which is up only 1% today. The fly in the ointment is the overhead resistance at the 39.5 level. The SPY and the DIA are both up about half of what these indexes are so maybe large cap will not outperform (lol).

The market internals continue to hang tough at over 2,000 more winning stocks than losers and the best sectors are Tech, Semis, Drugs, Banks, Reits, Retail and Homies. Oils and metals continue to trade lower and may be giving some good vibes to the market bulls as money comes out of those sectors.

So far, any dip bought today is a winner so glad I mentioned it at the open.

AFTERNOON PEAK


The markets continue to trade near their highs of the day and the leaders are Small Caps, Tech, Drugs and Banks. AAPL and GOOG have a bid today for the first time in quite a while and that is spreading to other tech. Losers are the metals with both oils and brokers trading near the flatline.

The trusty internals tell shows about 1,800 more winners than losers and that has not changed much all day. SPY never traded down to the 127 Pivot area so tomorrow is another day for a pivot touch as it is rare when it does not happen. Its on my radar for tomorrow.

The only other excitement about today's trade is the crushing of the Volatility sisters. Both VIX and VXO are trading down about 8% and both are now about 5% below their respective 10 day SMA's.

THE OPEN


The markets have shrugged off the early morning futures sell off and have opened flat to a bit higher. The market internals show about 1,200 more winners than losers and the winning sectors are Tech, Drugs, Retailers and Biotechs and the losers are metals and oils.

Pivot point on the SPY today is the 127 level and initial resistance is 128.

I am looking at the day from the long side with internals fairly strong and tech acting well. I don't expect a rip roaring day just buying dips and selling rips. Of course this could all change if the financials start falling backwards and what about the VG IPO. Not sure who to blame on that one, but I bet the brokers and the management of VG are high on the list especially in light of the shrewd comment the other day that VG may never be profitable.

INTERESTING READING


I recently purchased and last night I started reading a book called "Mastering the Trade" by John Carter. John has written at the Tradingmarkets.com site although I haven't seen anything there by him in a while. My initial reaction is that this book is one of the best as it outlines John's trading techniques and his screen setups. I find it very interesting to read what other folks are looking at all day and he sure has some insightful ideas on what to watch. He actually shows his screens and the charts that he watches in the book. Like myself, John focuses on Pivot Points and trades in an anticipatory manner knowing before the day begins where he wants to enter and exit trades. He analyses sample trades and identifies his entries, exits, stop placements and targets. He also has an interesting take on the TRIN TICK and Put/Call ratios and how they can be used in trading. John has a site called tradethemarkets.com and I intend to check it out and see if there is more helpful information on the site.

5.31.2006

WHERE FROM HERE?

The markets managed to close at their highs and the charts are looking a bit interesting. It looks like we can get back to the 1290 area which is also the distance between where we are and 1250. The momentum indicators seem to be saying that the short term bottom is in and after watching the afternoon post FED announcement action, I would agree.

The Volatility indexes are right back to normal at their 10 day SMA's so maybe things are calming down and we can begin the slow drift higher.

CRAMER TIME


Jimmy is excited about natural gas and CHK believing in the hurricane trade. I think they can predict hurricanes 3 months from now as well as they can predict the weather three months from now. Also note that the CHK guys were buying the CHK stock when it was 25% higher. They aren't all that smart contrary to popular belief.


No doubt Maria is a bit disappointed today as the markets are higher, but the SPY hit the high of its day around 11:00 this morning eastern time and the Oil stocks (OIH) are hitting their highs as I type. I just wonder if the oil stock traders are smarter than the administration and expect the Iran issue to heat up once the Iranian leader (guy with the long name) rejects the Condi plan.

The QQQQ has gone straight down after making its highs this morning and the hated IWM has basically flatlined at +1% but hit its best level before lunch.

The market internals continue to show about 1,500 more winners than losers.

Bottom line, it has been a volatile day with the FED minutes generating much of the action; my take is that we have moved into a new trading range where the SPY trades between 125 and 129 and I am not sure that is a bad thing for now. LOOKING FOR STABILITY.

AFTERNOON UPDATE


The markets continue to hang tough although off the highs of the day. I suspect we get another surge into the afternoon as the Small caps and Semi's lead the markets. In addition, the market internals arel keeping a bullish tilt with over 2,300 more losers than winners.

The best performing sectors today include the Small guys, tech, brokers, retailers, oils, biotechs and metals. Losers include the internets (HHH), YHOO EBAY AAPL and MSFT.

My question is if the Oils are doing this well today, what happens when Iran rejects the Condi proposal?

And what about those Volatility indexes. Seems like they alternate days when they go up or down 9%. Today its a crushing which might be bullish. And don't we all miss Erin when she is away on vacation?

INITIAL LOOK


The markets open green with about 2,000 more winners than losers. Big Cap tech continues to lag as the SMH is up seventeen cents and the QQQQ is up twenty cents. The Russell 2K is outdoing the SPY by .74% to .64% so they are neck and neck. Other sectors acting well include the brokers, oils and metals. Lagging sectors include the internets HHH (-1%) as GOOG and EBAY get price target reductions from Mother Merrill and the interest rate sectors including REITS and Homies.

Listening to Don Evans this morning on the question of Executive Compensation at XOM was quite comical as Don mentioned that XOM has a great board and the stock had great performance over the past 20 years. Don, do you remember Lee Raymond doubting the price rise in crude and repeatedly calling for the price to fall back to $28 as they saw no supply demand imbalance. What would Lee's compensation have been if he would have had a clue about the price of crude and where would the XOM price be if Lee had a clue as to the direction of the price. And for the doubters, pull up a chart of XOM vs VLO XTO FTO etc. Comical just comical.

TECHNICALS- NAZ COMP


I mentioned in my post last night that I anticipated a Positive Divergence to appear shortly on the SPY. We do not have to wait on the NAZDAQ as the momentum indicators pictured above including MACD Histogram, Rate of Change and Stochastics all show higher lows as the COMP has come back down and retested last week's lows.

Again, the general rule is that the momentum indicators bottom before the markets and hopefully that will be the present situation and the markets can go higher.

5.30.2006

HERE FIRST

Back at the end of April, I wrote a piece called Market Grumblings, where I discussed the Negative Divergence that the equity markets were making. A negative divergence occurs when an equity such as SPY makes a higher high and a momentum indicator such as MACD makes a lower high. If you look at the above chart, you will see that MACD made its high back in the November/December time frame but the markets made their highs in the middle of May.

The reason that a negative divergence occurs is because markets will start pulling back more often as they run out of upside momentum. Hence the prices may be higher than they were, but the momentum indicators will not. Check out the MACD Histogram above as the markets started losing their momentum over the last few months as the pullbacks increased in frequency.

We may now have the reverse as the SPY went straight down from 133 to the 125 level. It rallied back to 128 last week, but is now back at the 126 level after today's relentless selling. However, if the SPY gets back down to the 125 level, I feel confident that the MACD histogram and the Stochastic indicators will be at higher levels than when the SPY was at the 125 level last week. The reason being, the sharp rally Thursday and Friday caused a reduced amount of downward momentum. This could/should bring on a Positive Divergence and a bullish signal for the markets.


100 TO GO


That is correct, only 100 points lower and the DJIA will be leaving the 11K's and joining the 10K'S.

The markets closed on the lows with 3,500 more losing stocks than winning ones. The big losers were the Small cap group with the IWM down 2.75%. Other underperforming sectors included Homies, Techs, Brokers, Oils and Biotechs.

The Volatility indexes ramped higher as the VIX closed at 18.65 up 31%, and the VXO up to 17.85 and up 36.5% on the day. The Volatility indexes are giving buy signals as the VIX is now 13% above its 10 day SMA and the VXO is a mere 17% above its 10 day SMA. I am not buying the signals for now as I suspect we get a probe lower in the morning. That may be a buying opportunity but I will wait and see how the market shakes out mid day tomorrow.

STOP LISTENING NOW

Jimmy coming up here to tell us what to buy so we can make some "MAD MONEY". Hopefully, he will keep in mind that he called the new bull market on March 17, 2006. He is looking like a great contra indicator as the SPX has gone from about 1310 on that date to todays 1262, a loss of about 48 SPX points in a full two and a half months. I really do not want to annualize that negative return to aggravate all the bulls.


Jimmy is touting Regal Cinema as he says it may be able to guide higher. GS also on his list as he likes the new GS head. MRVL also to round out the afternoon.

For what its worth Jimmy is up to 805 picks according to the booyahboy site and believe it or not, the DJIA is slowly closing in on his performance. Hard to believe in light of the after market boost that he used to get.

SNOW DUMP


CNBC is getting tough to take with all the great stuff they say now about Treas Secy John Snow. According to CNBC, the markets have gone up X percent since Snow became the big man at Treasury in February of 2003. I think it was great timing on his part as he caught the market lows. As I recall, the Bush administration has been trying to find a replacement for the universally unloved Snow for months but no one wanted the top job at Treasury. Bush apparently could not take it any more so he pleaded with Paulson who was apparently on the "outs" at GS.

Maybe soon CNBC will tell me how great the markets have been since George W. Bush took office. Its not necessary, here are the numbers as the QQQQ started the Bush presidency at approximately 66 and it now trades at 39. Maybe they will also tell me that I am forgetting the 50 cent or so MSFT dividend so its really better than the 40% hair cut than it appears.

GETTING OVERSOLD AGAIN?


The equity markets refuse to rally as the market internals continue to show about 2,600 more losers than winners. The oils and metals have both flipped to flat and the big losers on the day are the retailers, brokers, banks, homies and internets. The HHH, after rallying the last few days on the heels of EBAY and YHOO is up to its old tricks of trading lower.

The Volatility indexes have ripped higher as the three day weekend is now history. The VIX and VXO are both trading at about 4% or 5% above their respective 10 day SMA's, so maybe a rally is near.

Revshark on realmoney.com mentioned an interest in the SMH and I do note that it is kind of outperforming today as it does less worse than general tech. He says:

"I mentioned Friday that I was building a position in the Semiconductor HOLDRs (SMH:Amex). I continue to do so today. I'm maintaining a mental stop on a closing basis of around $33.50. I'll look to add more aggressively on a move over $34.50. The semiconductor group had an upgrade today, and I like the way it seems to be stabilizing now on lighter volume. "

I hope he is right as the mood of investors/traders is pretty gloomy. If the semi's can catch a bid, it will be a nice feather in the cap of the bulls.

WHAT SAY YOU HANK?


The man from Goldman is not getting the warmest of greetings as the markets open lower, way lower, as the internals show 2,30 more losing stocks than winning ones. The small caps are taking the worst of the selling with the IWM lower by 1.3%. The other major market indexes are all down between 3/4% and 1% and the only distinct winners are oils and metals. Note the VIX back up over 16.3 and back over the 10 day SMA level. The 10 year Bond is back up over 5.07% so a bit of a head wind for equities.

BULLISH ON METALS

If one is bullish on the metals market it may be a good time to pick up some PAAS or SSRI as they have similar chart patterns. Both have had meaningful pullbacks and if you think that metal prices will be higher in the future as I do, this seems to be a good level to add inventory. Maybe even our guy Jimmy C will come out and issue a "monback."

5.29.2006

THAT'S ALL ?


I rushed home from the East End of Long Island to check out my stocks and my statistics and, yikes, is the Rally over already? It just might me be as the Volatility Sisters cratered over the last two days. The VIX is now sitting about 11% below its 10 day SMA and we know from prior history that the equity markets rarely make northerly progress when the VIX is this oversold.

In addition the SPX now has a 2 day RSI in excess of 90 and that is also a pretty good sell signal indicating the markets are overbought after the rapid move higher that began last Wednesday.

Keep in mind that both these indicators were way past normal levels before they turned. The SPX began its drop from the 1,327 level and hit the "bird flu bottom" on Wednesday at 1245, so that was about a drop of 80 and we have come back up by 35. I suspect the markets have further to go as there are lots of traders who want to short these prices. I will be looking to take some off on any northerly move from these levels.

LONG WEEKEND LINKS


Some Chatter that a Correction was due.

Some Golden Rules of Investing from Barry R.

The Yield Curve Inverted again?

As a time saver, here are Adam's Links.

Newt on Bush 3? Again?

Here we go again, but probably worse.

MSFT for EBAY?

Banking on Biotech!!!

Just what we need, Leveraged ETF's!!!

Get your $2,000 Gold.

Problem with Debit Spreads.

More on the Silver ETF and the Gold ETF.

Check out the Whole Site.

The Trusting Society.

Some Good Stuff from Lazlo!!!

Update on the Housing Markets.

Good or Bad Timing?

Bottom in?

John Murphy on the Markets!!!

The Oil Bubble!!!

Betting on Banks.

Doesn't get any Easier than This.

Here is some Breaking News.