4.01.2006

THE SILVER STANDARD

There has been lots of talk recently about the rip higher in the precious metals. Several months ago two ETF's for Gold (ITU and GLD) became available and one for Silver (SIL) will be available in the very near future.

So is this a good time to buy precious metals/equities? The answer is that the commodity and the metal stocks have had huge runs and are probably due for some consolidation or lower prices. However, the commodity run which began in 2003 probably has a lot of life left. Prior history indicates that commodity runs usually last ten or fifteen years so it may still be early in the game. In addition there is increased demand from the BRIC countries which will probably keep a bid under the precious metals for a long time.

There is also much speculation about the impact the Silver ETF will have on silver demand. I am not a silver expert, but I have read a number of articles indicating that the ETF will soak up a lot of the available silver. This article on Marketwatch delves further into the argument.

It is also hard to forget about the presumed top in Gold when the GLD ETF appeared in December of 2004. Gold was then in the $450 per ounce range and now it is $580. It was a good time to buy gold then and my suspicion is that if silver sells off on the debut of the ETF, it will also be a good time to buy.

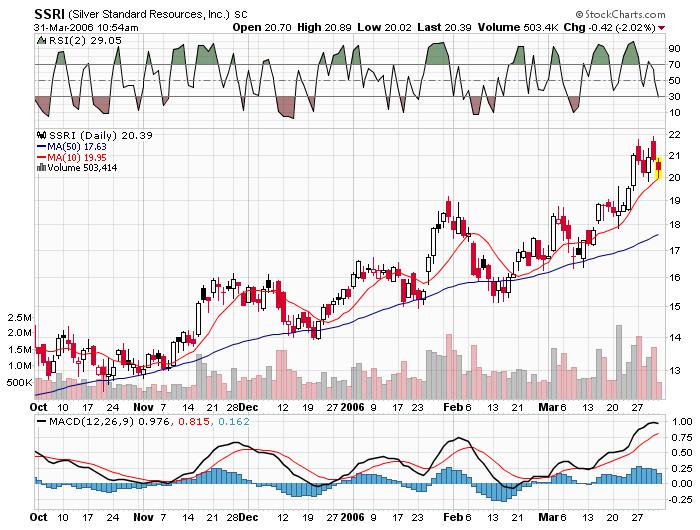
My plan is to buy the dips in Silver stocks such as SSRI and PAAS and have a somewhat smaller position in the silver ETF. The stocks mentioned are the favorites of Laurie McGuirk, the Metals maven at Minyanville.com and he has been spot on picking these stocks at much lower levels. One note of caution, just because a stock is a gold/ silver stock does not mean it will automatically go to higher prices if the commodity does. Stock picking is required.

3.31.2006

FIRST QUARTER UPDATE

Some more fun facts on the way the Quarter ended:

The biggest winners are the metals, oils and small caps and the biggest losers are the semis and the internets.


QQQQ +3.95%
IWM +13.88%
HHH -11.65%
SMH -.87%
GOOG -5.99%
AAPL -12.75%
OIH +13.98%
XLE +8.13%
VLO +15.85%
DIA +4.07%
GLD +12.64%
$HUI +21.46%
SSRI +34.15%
PAAS +34.89%
CHK -1%
INTC -22.03%
DRG +2.9%
IBB +6.65%
SPX +3.728%
MSH +4.958%
COMPQ +6.098%
NDX +3.55%
MSFT +4.05%

PIVOT POINT FACTOID

I have spent some time lately on the Pivot Point concept and I have some more information which may make for some profitable trading.

Today the SPY Pivot Point is approximately 130.1 and the price was touched in the early morning trade.

I have read studies which have found that the SP 500 Pivot Point is touched almost 75% of the time in the next days trading. For what it is worth, the Pivot on SPY has been touched every day since March 21. The Pivot on Monday for the SPY is going to be about 129.75 so if we close a little below that area it may be worth a shot to buy some SPY or EMINI's in the anticipation of that number being touched on Monday. It is not a home run trade but it is a high probability trade and one could adjust trade size accordingly.

1:30 UPDATE

Certaintly a snoozer in the financial markets today and it makes one wonder what exactly I am doing at the turret when it is 74 degrees outside. It seems like most traders/portfolio managers will be very happy to book their first quarter gains and refocus on Monday.

The Market internals are exactly flat, and the only sectors showing any movement today are the Oils(-2%), and the Metals (-2%). Banks Brokers and Retailers are a tad higher but it is generally mind numbing action.

The Volatility Indexes are drifting a bit higher and the SPY pivot point has held as resistance all day. Any drop into the SPY 129.2 area will probably catch my attention for a quick flip.

11:00 UPDATE


The markets continue to meander this morning with the internals flat as I type. The Financials are a tad green (.5%). Techs are flat and Oils (-2%) /Metals (-1%) are the worst performers. Note also that crude is down $1.4 to 65.75. T Boone on CNBC yesterday may have triggered a nice short term sell signal in the energy patch with his bold 75 before 60 call.

The Volatility Sisters are flatlining with the markets and I wish I saw something exciting. As mentioned in the earlier post, I expect better buying opportunities in the ETF's next week.

The Pivot on the SPY today is the 130.1 area and bursts above or below that area should be watched for market direction.

QUICK TAKE


A quick look at the market internals and I am not impressed with approximately 400 more winners than losers (unimpressive). Hence, I am selling the last of my ETF's with the intention of buying them back lower.

The Sectors moving the most in the very very early going are Brokers and Tech to the slight green and Oils, Metals and Interest Rate sensitive to the red (HGX REIT). The 10 year Bond is unchanged at 4.85%.

TECHNICALS QQQQ

The QQQQ is now a quandary as it has broken above its recent trading range of 40 to 42. It closed yesterday at 42.05 after hitting 42.3 in the morning. The quandary is we broke above the trading range and pulled back and the 2 day RSI is over 90, which is generally a good time to sell.

So what to do? I am inclined to watch the internals this morning and let them guide me. If they are strong I will probably hang on and try to sell them into the strength and if the internals are weak, I will probably sell out near the open and look to buy back at lower prices.

A LOOK BACK -INFA


INFA was mentioned back in early March as a stock to buy on pullbacks and this was the most volatile of those mentioned. However, there was opportunity to buy the stock in the 15 range and sell in the high 16/17 area.

My goal on the site and in my personal trading is to find low risk opportunity among stocks that are in strong uptrends. Low risk being defined as stocks with decent balance sheets, justifiable price earnings ratios, and "reliable earnings". I do not want to buy or discuss stocks that will be extremely volatile or blow up. Hence, I tend to buy stocks that look more like GWR or CIB than those that look like INFA.

3.30.2006

THE CLOSE


The markets closed mixed to lower with the winner being the NAZ and the loser being the DJIA. The SP500 closed down 2.6 points and is relatively unscathed. The internals finished moderately lower as there were about 500 more losers than winners. The NAZ internals were about flat.

The sectors moving the most today were Tech (MSH +.9%), Oils(+1%), and the Metals (+3%). The losers were fixed income as the 10 year climbed over 4.85%, the Homies and the Reits on the heels of the rising rates.

For those watching the SPY, it is interesting to note that it closed right at its daily Pivot Point and hung around there most of the day. Tomorrow's Pivot is at the 130.15 range so it will be interesting to see what tomorrow brings (always).

The VIX and VXO both shot up approximately 6% today and I believe they will keep a floor under the market if they can make it to the 12 and 11 range respectively.

STOP TRADING NOW


Cramer was just on giving UNH as a top pick. He has been very bullish on this for a long time and he is probably right. It is now trading at about 17x forward earnings, will earn about 2.9 this year and close to 3.4 next year. This is a stock that will do well if the economy slows and folks start dumping cyclicals. It is also down over 15% from its December high so this is probably a decent entry point.

VIX TRIX

The VIX is trading up to 11.65 now and a lift to the 12 area will probably signify a good buying opportunity in the index ETF's. I have no clue as to why the VIX and VXO are "ramping" higher today, but I do know my target is 110% above their 10 day SMA for a buy signal. I have also learned it does not pay to ignore the signals as they are usually correct. Note Tuesday's ETF purchase in the late afternoon.

2:00 UPDATE

Back at the trading turret just in time for the Major League Baseball News Conference. This will be interesting.

The markets however are not so interesting as the 130 Pivot range on the SPY gives the market some support. The market internals are about 600 to the red and the major market sector winners are the Oils, Techs and Metals. The "forget the Naz" index is green while the DJIA and the SP 500 are red to pink.

The 10 year Bond is over 4.85% and this is causing a selloff in the Homie and Reit sectors.

Some good news is to be found with the Volatility Sisters as they lift approximately 6%.

I expect another lift this afternoon on the theory that the internals have not gone too far to the red.

LUNCH TIME RANT


Lots of yammering this morning about the selection of former Senator George Mitchell to investigate and solve the "Barry Bonds Steroid Problem." The issue is baROID is close to passing Babe Ruth in career home runs and may eventually pass Hank Aaron's 755 all time record. baROID currently has 708 home runs after twenty seasons and he will be 42 years old in July.

Obviously, the record keepers can no longer test Barry for steroids he may have taken in the late 90's and early 00's (and may still be taking).

Even if they could, the testing will not detect human growth hormone or other high level performance enhancing drugs because the CBA agreements do not permit blood tests. In addition, the players and their suppliers are far ahead of the testers with their masking agents and undetectable cocktails.

Therefore the answer is clearly with the guy in the picture, AROD. He is 30 years old and has hit 429 home runs in his first 10 full seasons. It is my opinion that the non ROID using AROD can reach the 800 mark if he stays healthy. He would need to average about 40 home runs a year for the next nine years to reach the 800 mark and pass however many Bonds may hit. That is the solution to the Bonds problem and not George Mitchell or Bud Selig. If that happens, baROID will become a laughable, forgettable asterisk in the annals of Baseball History.

11:00 UPDATE

The SPY hit its head this morning at the 131 area or Second resistance and I sold the balance of my stock that was purchased on Tuesday. The "tell" again was the "lackadaisical" action of the market internals. They never got near yesterdays numbers and started rolling over soon after the open. They are now about 600 to the red.

Todays Pivot Point is back at the 130 area and that may be a good buy area for a day trade if the internals don't get too much worse.

The best performing sectors so far are Tech(+.65%), Metals (+2.5%), and Oils(+.5%). All the sectors are way off their opening hour highs. The worst performing sectors are Homies(-.5%), Reits(-.5%), Consumers and Retailers.

Please note that the 10 year Bond is up to 4.85% and they put a little cap on stocks for now.

FORGET THE NAZ UPDATE


The markets are continuing their move higher this morning as the NAZ (see chart above) continues to lead the way. It wasn't long ago when our guy Jim Cramer came out with the "forget the Naz" statement.

Today, the techs are higher again with SMH (+1.5%), MSH (+1.3%) etc. Other sectors doing well are Oils, Brokers and of course the METALS(+4%).

Market internals are strong at 1,300 to the green but not as strong as yesterday and note the Second Resistance at 131.15 on the SPY. I think it will have a tough time breaking through that area today as it currently trades at 130.9.

A LOOK BACK - GG


Back on March 5, I discussed a few stocks that were doing well and looked like good purchase candidates on pullbacks. Well today is the day for GG. This morning it is up with all the metals and trading about 5% higher in the $30 area. Looking at the chart, there were plenty of opportunities (mon backs) to buy in the 26 area.

I like to feed the ducks and sell partial positions when the ducks are quacking and this morning they are quacking quite loudly.

3.29.2006

JUST A HEADS UP


I was just reviewing my daily spreadsheets and I noticed that today is the first in quite a while where the NAZ has led the markets. That could be a preview of coming attractions and if the NAZ continues to lead it will probably mean that all markets are going to follow it higher.

The other day I mentioned that the SPX was trading in a very narrow range and had low volatility. I guess we have all noticed the greater volatility the last two days. That may also be a precursor to higher markets in the near future.

THE CLOSE


The yammering about the markets on CNBC continues and I have a secret to tell them. The SPY closed at 130.16, just where I made my first sale at 11:45 AM. If I told Maria that I sold at the closing price before noon, I bet she would not believe it. But that is CNBC.

The QQQQ was a different story as it closed up almost 2% led by the SMH (almost 3% higher).

The other leading sectors were Brokers, Reits, Oils, METALS (+4%), AAPL and GOOG(both up about 5%).

The Volatility Sisters are lower but not giving any sell signals.

Kudos to the traders who followed the advice to buy TWX as it closes 5 cents to the green (lots of value).

The key story of the day in my very humble opinion is "watch the internals closely". They generally are the best market "tell."

NOT WAITING FOR STOP TRADING NOW

Lets see, here is what the crowing rooster (Jim Cramer) said yesterday at 2:29 EST after the fed release:

"It's a buying opportunity, but you have to wait until Wednesday to make your move, just in case we get leaks from this Fed that we didn't get under Alan Greenspan. Watch and wait. Until tomorrow. "

Today, we get this gem 12:43 EST:

"This market is bursting with pleasure. Frankly, it doesn't make any more sense than Tuesday afternoon's action. Remember, it wasn't a "good" statement the Fed made, it was simply a reaffirmation that we weren't done with the rates hikes coupled with some horrendous language about the end of the temporary slowdown.

But let's go back to the thesis I articulated at the beginning of the week. You would get the big bad event, and once it was through, you would then get a ton of end-of-quarter buying because you will not be nailed by the authorities for walking a stock up with two days to go and then keeping it there with heavy buying underneath."

I guess he has already forgotten what he said yesterday. What a joker.

130 UPDATE

The markets continue to act well and a nice flag pattern has developed at the 130.15 mark on the SPY. The markets internals have held steady also 2,800 to the green and another ramp higher today is probably in the cards. Just as I type the ramp shows. Note today the burst higher in QQQQ and SMH, both up in the 2% range.

The sector outperformers are Brokers, Small Caps, Reits, Oils, Metals (+3%) and Tech and even the MSH is higher by (1.5%). The laggards are the Drugs and the Volatility Indexes. The Sisters are not giving sell signals yet but I will be watching for further drippage.

For those who like to sell them lower and buy them higher, please note that is generally the wrong way. The time to buy was yesterday; please see yesterday afternoon' s posts. The time to sell, well I would rather sell to early than to late.

SPY UPDATE

The SPY is now up a buck from the buy yesterday and I have taken some off at the initial resistance point of 130.15. I do not expect the second level of SPY resistance at 131 to get touched today.

The major tell of the day was the market internals +2,800 not breaking down as the indexes dipped in the early going.

All the sectors that I monitor are green with the Brokers, Reits, Small Caps, Metals and Semis leading the way. The laggards are the Oils, Consumers and Homies.

Not sure why the REITS are doing so well. Just makes me wonder if the fed is done.

ONE MORE THING

The chart above of the BROKER/DEALERS, the likes of GS MER BSC LEH etc is just a steamroller. The general rule is that where these guy lead the markets will follow.

Some may see a cup and handle here, some may see the momentum rolling over, my take is BUY THE PULLBACKS.

By the way, MS has been lagging the group and my impression is that if things don't improve there, it will be taken out at a nice premium.

MORNING LOOK


The indexes are barely higher this morning but the internals are telling a different story as they
are about 1,100 to the green.

The sectors leading the way are the brokers (+1.25%), reits (+1.66%), Small Caps(+.4%) and GOOG (is that a sector unto itself) up 7 or almost 2%. The oils will probably be a battle ground until 10:30 when the crop report shows.

I am hearing the generally bearish Doug Kass is jumping on the cheap ( former Cramer favorite circa 2k) TWX. It has plummeted to the 16 and change area and he is probably correct.

Another stock on my radar is VSL. This has been a favorite of Jay at globaltechstocks.com (sub required) and it has been a home run. Jay Adam and TC are a terrific read on that site each and every day.

The Pivot Point on the SPY today is 129.6 with resistance at 130.15 and support at 128.7.

ANOTHER TAKE

Dick Arms has a column this morning on realmoney discussing the possibility that the major market indexes may slide back to their recent lows. Here is his analysis:


"After moving sideways for eight sessions, the markets appeared to make up their minds Tuesday: They backed away decisively from the resistance that had been stopping them.

The Dow and S&P 500 broke below the bottom of the consolidation, suggesting they were entering a short-term pullback phase. The Nasdaq did not break support, but it, too, looked weak Tuesday.


Since late November we have seen four quite regular cycles, each lasting a little more than a month. The recent high appears to fall right into that pattern, implying that a slide lasting two or three weeks is likely. That would suggest doing some selling in aggressive trading accounts, with the intention of coming back in on the next low. The cycle pattern would put that low in about the middle of April."


My take is a bit different. The SPX seems to have broken above the recent trading range and now the former resistance in the 1290 to 1300 range becomes support. In addition, on a shorter term basis, the 2 day RSI of under 10 has now appeared, so for me its time for a shot from the long side. The rule is buy when 2 day RSI is under 10 and sell when it is over 75. For what it is worth, I prefer to trade by scaling around the numbers. Unfortunately, the Volatility Sisters have barely lifted and I prefer to trade when all of the signals align so I am not making my biggest bet.

3.28.2006

POST BERNANKE LINKFEST

YOU ARE NOT ALONE


Just as soon as I write my 2 day RSI post I find that I have some good company on this trade:


"Given the recent propensity of this market to quickly reverse any sharp spike, the program-driven feel of the action, the profit-taking by bears who were short into the Fed news and window-dressing pressure that is likely to emerge as we wind up the quarter, I'm looking for a pretty quick reversal. I'm contemplating some index longs before the close. This is a dip that invites buyers, not more selling."

Yes, that is correct, the other guy, REVSHARK.

2 day RSI UNDER 10


Ok, there we go , 2 day RSI of the SPY is now under 10. Pay no attention to the number in the picture as that is a delayed quote. The SPY is as I type 129.24, which is a 2 day RSI reading of under 8. The QQQQ and the IWM are not there (yet) and the Volatility indexes have moved a bit but no where near the 110% of 10 SMA that I like to see. So this is probably a time to begin to scale in to some long SPY.

FED NOT DONE AGAIN

For those waiting to fade the initial drop lower, well we are still waiting for the turnaround and it doesn't look like its coming today. The SMH is leading us lower down 50 cents or 1.5%. The internals have flipped to 1,500 to the red. Thank goodness my guy Jim Cramer has the answer. This is his latest well thought out non spur of the moment trading idea at 2:29 PM eastern time:

"It's a buying opportunity, but you have to wait until Wednesday to make your move, just in case we get leaks from this Fed that we didn't get under Alan Greenspan. Watch and wait. Until tomorrow. "

Simple don't buy today buy tomorrow. Boy this stuff is easy.

STORM COMES


Fifteen minutes after the announcement and the markets are lower as the SPX is now back under 1300 and the NAZ which was up about 12 earlier is now lower by 7. The fear is rates will continue to go higher as the economy "rebounded strongly" and a favorite "resource utilization poses inflation risk."

Keep in mind that the first move off the fed announcement is usually faded. So far no sign of a turnaround.

CALM BEFORE STORM


The markets continue to trade in a tight range as the SPY is now up 38 cents and the QQQQ is higher by 24 cents. The big winners on the day are those invested in the energy patch as the OIH is up $3.70 or 2.6%. The winners thare are HELS HAL XEC RRC XTO HP LSS NOV and of course VLO and FTO. Volatility Sisters are unchanged, GOOG +5, GS +2, AAPL pinkish and MSFT is, yikes, higher by 16 cents.


Market internals have flipped from red to 450 to the greenside.

Other winning sectors on my screen are Homies even with the 10 year up to 4.74%, Retailers(+.5%), Internets (HHH+2%) are trading higher and the Semis are back to flatland. Metals and the consumer stocks are flat to lower.

This will all change at 2:15 as we either rip higher or plummet lower. My guess is we go higher.

HEY BARRONS

Long term chart (three year) of VLO looks like the management over at that company and its predecessors have done ok. Granted they have recently had the wind at their back with higher crude prices but isn't timing part of the battle. The stock trades at the whopping multiple of 7x and if crude trades back to 28 a barrel it will no doubt go lower.

CALMING EFFECT


I have a feeling its going to be a fairly calm(boring) morning. The volatility should start at about 2:15 so rest up for the afternoon activity. So far, the internals are about 700 to the red side and the SPY is unchanged with the Small guys a bit lower. The Volatility Sisters as usual are unchanged.

The Sectors moving today include Oils (+1.5%) and Metals (-1.25%). The 10 year Bond is back up to 4.75% GS, the great short killer is up another 1.5 points and GOOG is up 4+. The Semi's are unchanged even as LEXR warned.

I also hear all the CNBC yammering about todays change at the Oval office as Card is out and Josh Bolten is in. Does anyone have any backtesting evidence on how a change of the White House Chief of Staff impacts the markets (lol).

MEAN REVERTING VOLATILITY


The old adage is that Volatility is mean reverting. As of yesterday's close, the price of the QQQQ, the 10 day SMA and the 50 day SMA are all about 41.33. The MACD Histogram is also about zero, and the 14 day RSI is right in the middle at 51. The Bollinger Bands have also contracted to a range of 56 cents, an unusually low top to bottom range.

What this means is that I do not have to go other blogs or websites and see pictures of paint drying to know what is happening in the markets . I know there has been very low volatility in the market over the past several days, but, I also know that Volatility is mean reverting.
This means that if volatility is low now it will be higher in the future and vice versa(see Sheldon Natenberg Option Volatility and Pricing). Therefore, I expect the markets will make a "decent sized" move in the very near future. Which way? The answer from the great technicians is that the market will generally move in the direction of the longer term trend. The top chart is a picture of a QQQQ weekly chart from April 2003 and from the looks of that chart, one would have to surmise the next move to be higher.

3.27.2006

THE ANTICIPATED CLOSE


The markets are mixed and I am tired of looking at the non changing screens. I have been waiting for the SPY Pivot Point to work and it has been a waste of time as it is sold every time it gets to 130.2.

So I say why throw away good time after bad and after I here from my guy Jim Cramer, I will be going to meet up with the weight room.

The market internals never could get quite to green so that was a pretty good tell it wasn't going to happen. I did however make some dough on my metal and oil stocks.

Sounds like a bottom forming on AAPL as Cramer is bearish on it yammering about the shorts knocking it down today. He is probably the best contra indicator on TV.

TECHNICALS -XTO

One of the CEO's mentioned in the Barron's article was Bob Simpson of XTO. Above is a three year chart showing the stock going from about 12 to 43. This stock has been a buy the pullback stock forever and I think this time is no different. Eventually they will probably get taken out by a bigger oil company, but this looks like a grand time to buy.

The company announces increases in reserves on a fairly regular basis and the CEO is probably the best in the industry. If the stock chart is any measure he certaintly is.

2:00

The markets internals are getting a bit stronger as I watch today's trade. We are now back to 700 losers over winners and it seems that the market wants to go higher. We were rejected twice so far at the Pivot, but I think the 3rd time may be the charm. I will be watching the 130.2 level on the SPY with great curiosity.

The leading sectors as of 2:00 EST are Semis, Precious Metals and now the oils. AAPL GS and GOOG are hanging in the green. The financials trade mixed and the losers are Bios, Drugs and some of the consumer stocks.

NOON UPDATE


Its a snoozer of a day unless your invested in the precious metals sector. As of noon, the HUI is +3% and the XAU is +2.5%. The winners are EGO, MDG, RGLD, GSS, PAAS, GLG and GG.

The market internals are about 1,100 to the red and the market winners are still Semis (+.5%). The NAZ is higher by one point while the SP 500 is lower by 2.6 points. Small Caps are underperforming with the IWM lower by .4%. The oil stocks are generally lower but FTO and VLO are bucking that trend.

AAPL as usual is giving up its early gains and GOOG/GS look strong. One other bit of good news is the Volatility Sisters are up between 3 and 4%%.

I am watching the action in the SPY and if the 130.2 Pivot Point can be approached and the internals start to turn the market may ramp higher.

TECHNICALS - VLO


That is a chart of VLO- the oil refiner and all of a sudden the chart and the fundamentals are looking darn good. Our guy Cramer came out with a big sell on the refiners in mid February and he could not have made a worse call. How can someone as guru like as he call the exact bottom
with his sell call?

What I have noticed is that this stock along with FTO move up almost everyday and if gasoline gets expensive this summer, these stocks will be primary beneficiaries. The company is slated to earn in the $7 to $8 range this year so its not a very expensive stock. Management is also known to be top notch. I would like to buy pullbacks in VLO to the mid 50's and I do own some at considerably lower prices.

10:00 VIEW


The indexes overall are blah this morning with some standout sector/stock performances. The NAZ is leading the way led by Semi's(+1%) and INTC (1.5%). The other hot sector for now is gold and the metals. The HUI (+2.4%) and XAU(+1.9%). Oils are lower today with the OIH (-.66%) and GS/AAPL both up over a buck in early trade.

Market Internals are about 500 to the red and the Volatility Sisters are trading a bit higher.

The Big Caps shockingly are lagging again and note that the Pivot Points today on the SPY are approximately as follows:

PP= 130.20

Resistance = 130.60

Support = 129.8

The general rule is if the security trades above the Pivot it is bullish and below is bearish.

BIG CAPS VS SMALL CAPS


So there is a chart of the SP 500 and the Russell 2K (IWM). It looks like the IWM has again taken the lead as the talking heads continually yammer about the outperformance of the BIG Cap stocks. I do not think so. The IWM broke out on Friday to a new all time high, and up over 1% on the week and the SPX is down on the week.

3.26.2006

BARRON'S


BARRON'S has highlighted the following in Monday's edition:

Art Smith of John S. Herold Inc. likes the following energy stocks:

XOM CVX COP REP E APC DVN CHK KMG PPP PXD XEC THX WLL.

Joel Greenblatt, the author of the The Little Book That Beats The Market, whose website, magicformulainvesting.com, has identified the following as attractive:

FCX IPS FTO KG HOC AEOS DLX KSWS KMG TBL UST CECO YCC GIB CSGS.

Michael Santoli, the terrific writer of the "the trader" is bullish on WEN and bearish on THI.

In the article The World's Best CEO's, I am not in complete agreement with the author/authors however the CEO's on the list that I am fond of include Fuld at LEH; Frankfort at COH; Lafley at PG; Mason at LM; Mozilo at CFC; Simpson at XTO and of course Steve Jobs at AAPL.

And for the pans; Why is Jeff Immelt on the list? Since he became CEO, GE stock has decreased on average -2.8% per year while the SP500 has climbed about 5% per year. Contrast Immelt with Simpson, XTO went public in 1993 and the stock is up 40 times in that time, or even stodgy big cap Proctor and Gamble, where the CEO has been in control since 2000 and the stock is up an average of 14% per year.

A LOOK BACK- CIB

One of the stocks I mentioned a few weeks ago, CIB is now back at its highs after pulling back and giving the dip buyers an opportunity to buy. The stock is now number 27 on the IBD top 100 list and supports a RS and and EPS rating of 95. This big Columbia bank looks attractive on pullbacks.

RANDOM LINKFEST