4.14.2006

TECHNICALS - OVTI

OmniVision Technologies, Inc. is engaged in the design, development, and marketing of semiconductor image sensor devices. The stock currently has an IBD EPS ranking of 97 a RS ranking of 96, and is number 9 on this week's IBD top 100 list. The chart set up looks favorable as the stock is about 8% off its 52 week high.

WEEKEND RANDOM LINKS

4.13.2006

GENIUS

One of the first things I remember reading when I was contemplating becoming a full time trader was that if you are confused as to the trend, expand the time frame and see if it makes things clearer. I hate to say it, but yes this 3 year chart on SPY is pretty clear. We are in an uptrend and any dip purchased in the prior three years would have been a money trade. The odds are with it to continue to be a money trade.

A few interesting tidbits- year to date returns on various Stocks/ ETF's:

QQQQ +4.3%

IWM +11.85%

HHH -12.6%

SMH +1%

AAPL -7.5%

OIH +17.4%

XLE +11%

DIA +4.16%

INTC -22%

DRG +.68%

IBB +1.1%

MSH +5.36%

SPX +3.27%

NAZ COMP +5.48%

MSFT +3.6%

GOOG -3%

VLO +24.9%

SSRI +36.7%

PAAS +34.4%

$HUI +25.9%

GLD +15.4%

MATH

There up above, its a six month chart of SPY. Is it an uptrend, a trading range or a the beginning of a down trend. Inquiring minds want to know; this one included.

The ETF is trading at about its still uptrending (barely) 50 day SMA and the 2 day RSI is at about the 20 level.

The VIX and the VXO are still about 5% stretched from their respective 10 day SMA'S, so the indicators tell me its still time to be long.

The Pivot for Monday is should be right back at the 128.9 level and support and resistance are going to be at the 128.3 and 129.2 respectively. I plan to hold over the long weekend and look for buyers to come in on Monday.

2:30 LOOK


Many traders are asking the same question I am asking; I knew today would be like this, Why am I sitting watching the screens? The SPY continues to trade near the Pivot Point (128.9), hopefully, we get one more ramp on the day into the 129.2 level which can then be sold. The NAZ internals have held up all day around the positive 750 area.

Technology and the Semiconductor stocks have been the leaders all day (bullish) with most of the other sectors being relatively flat. Oil stocks have rallied and are now firmly in the green.

The Vix and VXO are basically unchanged and remain in overbought territory. Oh, and AROD and Jeter, hitless on the day.

BOREDOM

Boredom sure does reign and I have switched from the genius of CNBC to the excitement of Yankee baseball. I have also bought some SPY for a day trade at the 128.9 area for a quick flip. This is the Pivot area and I expect some support at that level now that the Naz internals have flipped to a strong 750 to the green.

I wish I had some great insight into todays trade , but I think its just buy dips and flip rips as I expect the pre holiday trade will meander in a fairly tight range.

Tech/Semis are still the strongest sector, which is bullish, and homies and reits are lagging. Oils and Metals are meandering flat, and yikes, the IBB is green (+1%) on the day.

THE 11:00 SHRUG

The markets have shrugged off the 5% yield on the bonds and have now flipped to the green. The Naz and Tech are leading the way with the MSH higher by .8%. The market internals have flipped to +735 on the Naz; NYSE internals are flat but my take is that the fixed income "stocks" are tainting the stat. The SOX and the SMH are both 1% higher and INTC is up 2% on an upgrade.

The oils have now flipped to flat and the metals are trying to make a stand lower by .5%.

The SPY Resistance in the 129/130 level will most likely keep the major indexes from getting much more of a ramp today.

OPENING LOOK

The chart of the 10 Year Bond is telling quite a story. The story is straight up since a 4.3% rate in the middle of January. Its funny how back when the rate was 4.3% all the chatter was about inverted yield curves and why that was bad for equities. Now, with higher rates, the chatter is that equities have to compete with higher rates which will yield lower p/e ratios and lower equity prices. This chatter I believe to be true and is currently putting a damper on equity prices. The markets are oversold and they have not been able to rally from the oversold levels because of the continuing rise in rates.

The open looks lackluster as market internals show losers ahead of gainer by 1,900 issues. It is interesting that the tech sector is the onlyone with a bid as the SOX index is up .5% and KLAC up another beaner. SNDK is higher on the SPX add and the oils are continuing there southerly journey down by about 1%.

The SPY Pivot Point today is the 128.9 area, and I would look to sell any rallies to that level. Multiple support exists in the 128 area resistance under the 130 levels.

4.12.2006

WELCOME


This is definitely one of the more boring trading days as the range on the SPY has been a whole 52 cents and even better on the QQQQ as the range there is 28 cents.

It is my opinion that the market would have rallied if the 10 Year Bond were not sneaking back to the 5% level. It is currently trading at 4.976% and if it goes lower equities will probably go higher and vice versa.

The market internals keep flipping from green to red and back so I will call them flat. The sector mover of the day are the metals, up over 2% with PAAS SSRI NEM and RGLD leading the way higher. The Oils are a bit lower as crude has traded back down under 69. There are lots of former bears on Oil now getting bullish for a push higher. Hmmmm, hate em at 45 love em at 69. That doesn't sound like a strategy I wish to invoke.

The SPY has basically been treading water all day trading under its daily Pivot Point of 129. The trading for tomorrow will probably be similar as many traders take the rest of the week off.

THE BUSINESS WEEK BOTTOM


So the blue chips have been underperforming the Small cap stocks for how long? The chart I just looked at showed the IWM has outperformed by about 50% over the last five years. So is the worm about to turn? I know lots of smart guys are making the bet on the turn by being long SPY and short IWM. Not sure its time yet, but it will happen.

THE BATTLE


The bulls and da bears are battling out and right now and I would give the edge to the bulls as market breath has flipped to 800 more winners than losers with NAZ internals leading.

The sectors impressing the most are the Small guys(+1%), Semis(+1) and the Metals(+2%).My favs in the Silver patch, PAAS and SSRI are acting quite well.

KLAC in the Semi sector is up a buck and that is always a good sign for the bulls.

Volatility Indexes are down a bit and I do not expect much change there for the rest of the day and I do not expect much fluctuation in the indexes as the holiday trading will kick in shortly.

WORLD HAS NOT IMPLODED


So far so good as the world has not imploded and the market has not crashed. As a matter of fact, the SPY has traded right back to the Pivot of 129 and there are 200 more winners than losers.

The leading sectors are Small Caps(+.4%), Financials (.35%) Semis(+.6%)and of course the metals (+1%).

The 10 Year Bond is back down to 4.92% and I would watch any slippage there for signs that equities can get some traction. Also, note the OIH can't get traction. Why would that be selling off if with all the Iran chatter?

Jim Cramer over at realmoney.com had some insights this morning and I quote"

"It's just that you can't trust the market. We have had no crescendo, no big give-up, just the dribs and drabs that never produce a bottom. Sure, maybe this time is different and we'll get a bottom based on nothing, without the big give-up. History says no, though. History says we will have another failure today.

I, like you, don't like this market. We are levered to oil, gold, silver, zinc and copper. That's just plain unhealthy. In every case when you get those going higher, there's so much that can go lower. "

Don't lose sight of the fact that on April 3, 2006, Jim wrote a column called "A Dozen Reasons to Love this Market." It is comical, yes, correct the SPY hit near its high of 131 on April 3.

TECHNICALS SPY / BIG ARMS


The SPY pulled back yesterday and closed near the 128.5 area. This morning futures are a tad higher. Dick Arms on realmoney.com is getting concerned about a possible downtrend as he says;

"For a number of weeks, I have been warning that the markets looked as though they were encountering resistance, were overbought and would move out of the consolidation to the downside. Tuesday's action was very important and telling on this point, I believe.

An early attempt to rally quickly failed on no apparent news, and the subsequent drop, while not huge, was enough to decisively break two important levels. One was the bottom of the consolidation that we have been in for the last three weeks. The other, and probably more important, level that was broken was the uptrend line that goes back to last October.

Breaking that uptrend line is ominous. That break says the intermediate-term market direction has changed from up to sideways, at best, and perhaps to down.

If you have not acted already to nail down some profits on earlier buy suggestions, I do not believe it is too late. "

Dick could be correct and we may be starting a downtrend. My take is a bit different. I think we are at the bottom of the trading range in a rangebound market. All the bearish talk I hear now is reminiscent of all the "happy talk" I hear on CNBC when the DJIA goes up 150. Has anyone thought that the Iran problems get resolved favorably and oil goes lower with commodities. I like to anticipate where the market is going rather than focus on where it went yesterday.

I will continue to follow my signals and right now they are all giving buy signals.

4.11.2006

THE CLOSER


The markets close just as the guy on the left sends one into the left field stands. Enter Sandman and we will see if he can close the deal.

The markets had an ugly day as the market internals were about 3,000 to the red. I do not know how many folks have picked up on it, but the SMH only lost twelve cents today( the first to turn)? The Volatility Indexes came through with enough fear to give buy signals as did the low price on the index ETF's. The IWM took it on the chin the most and now sports a 2 day RSI of 3.4.

I think we get the bounce tomorrow but I also think we get a probe lower which may shake out some weaker holders.

JIMMY CRACKED


No point in tracking Jimmy today as he doesn't give us a pick for the Maserati and says to buy Alcan Aluminum. No mention of the BOL blowup either. Ok, maybe it never happened.

Back to the important stuff, the market internals are dismal at 3,200 to the red and lots of depressed people on CNBC. Is that a tell? Also, I just heard Maria B tell us all what a great year tech has had already. Y0, Maria, the QQQQ is up about 3.5% on the year and the Morgan Stanley Hi Tech index is up 4.5%. I think most folks would be disappointed if that were considered a terrific quarter.

The Volatility Sisters are our lone bright spot on the day as the VIX and the VXO are both giving ETF buy signals as they are stretched more than 10% from their 10 day SMA'S.

SPY has hit the level I was looking for and is now trading at 128.5 with a 2 day RSI of under 9 and I continue to scale in to the trade.

Tomorrow's Pivot Point looks to be in the 129 area and support and resistance at 127.8 and 129.65.

DEEP THOUGHTS


So its 2:00 and we have seen not a glimmer of any attempt at a rally. The market internals are now 2,900 to the darkside and the only sector green is, oops, there is no sector to the green.

My question is this; if the selloff is due to IRAN and their appetite for nuclear weapons, why are Oils and Golds lower? My feeling is this is a technical selloff to the 128/129 area and the guy in Iran is a good excuse.

The SPY 2 day RSI is about 10, the VIX giving a buy signal with the 10% stretch, and I have dipped in on some SPY in the 128.75 zone. I have plenty of ammo for scales at lower prices.

I read an interesting quote while away over the weekend; "The difference between a successful trader and a not so successful trader is the successful trader does not make a habit of buying the high of the range or selling the low of the range."

DID NOT TAKE LONG


Did not take long for the SPY to fall off the table. Right down to the Second level of Daily support and the first level of Weekly support at the 128.8 area. I am not very confident that these levels will hold today as the action of the market internals is very weak (-2,400) and the only sector I see to the green side are the metals.

My plan 0f action is to start scaling in to the ETF'S as they are now at the buy levels for both the 2 day RSI signal and the 10% above the VIX stretch test. However, I expect to see the 128.5 area and that is where I expect to use most of my ammunition.

Everyone's favorite gold stock, KRY, is now down about 15% from yesterday's high and gold has barely budged. Hey Jimmy; Where does this "stock" trade if gold tanks all the way down to $575 an ounce?

10:00 UPDATE

The markets have opened and its plenty dull. I suspect the drop in the 10 Year Bond rate to 4.93 is giving the market a little (very little) bid. NAZ -1.5, SPX +1.

The IWM is lower and this may be a little preview for the bigger brother indexes. Market internals are pink and the usual sectors are leading the markets, Oils (+1%) and Metals (+2%).

My best guess is that this week is one to use for vacation or to join the folks at the big ball park in the Bronx.

OPENING TODAY


Its opening day in the bronx but its also time to take a look at the Buy and Sell indicators on some of the ETF'S.

The VIX is now at 12.19 which is about 5% above its 10 day SMA. The general rule is that when the VIX is stretched more than 5% above its 10 day SMA it is not the time to sell stocks.

The readings on the VXO are similar and with yesterday's close of 11.67, it is also about 5% above its 10 day SMA.

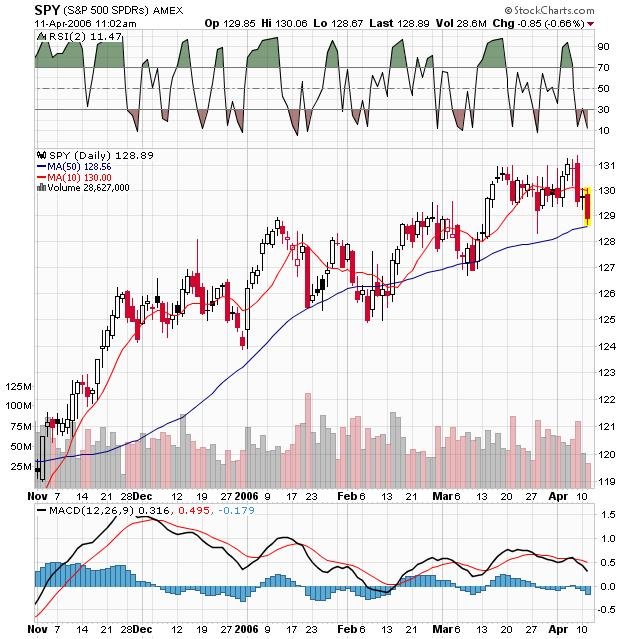
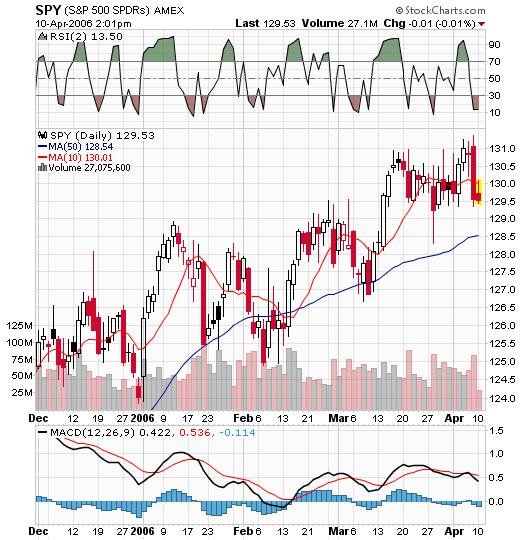
The 2 day RSI on the SPY is 31, IWM 14, and the QQQ 27. So we are fairly close to buy signals on these indicators and if today is a down day we may get there.

The Pivot Point on the SPY today is 129.7, First Support is 129.3 and Resistance is 130.15. The Weekly Support area is 128.8 and Weekly Resistance at 131.
Also, if one looks at the SPY chart, it is apparent that the SPY broke out of its range in mid March at the 128 area. It would not surprise me if we retested the 128.5 area and put in a short term bottom there.

4.10.2006

TECHNICALS - SPY


The SPY was rejected at the 130 area and is now back down to 129.4. I continue to believe we will see the 128/129 area (daily/weekly SPY support) before too long and that is where my buying interest will perk. Also, note on the above chart that the SPY broke to the upside from the 128 area in mid March. Another support tell?

The market internals have now flipped to 1,300 red. The Metals have also flipped to slightly pink and the only sector that I see as green are the Oils. All the other major market sectors have flipped to flat or red.

1:00 UPDATE AND A FINAL KRY

The 130.1 Pivot Point on SPY remains a big obstacle for the markets today and the market internals have said pretty loudly that we are not going anywhere far today. The DJIA is +39 but the NAZ is flat and the SPX is higher mainly on the oil patch stocks. The Metal stocks continue to act well but the techs and the Volatility guys can't get anything going.


The final on KRY is this- the stock is trading at around $6 today(lower by 1%), and the price of gold is approximately $593. When Jimmy said to back up the truck on KRY it was trading at about $3 and gold was trading at about $560 (March 24) .

In September/ October of 2005 the price of gold was trading in the $475 range and KRY was fetching a whole $1.5 and in November of 2004 when KRY was trading at $4.5 and gold was trading at around $450.

Note to self or loyal Jimmy followers: What exactly does the price of gold have to do with the price of KRY?

THINGS THAT MAKE ME GO HMMMM

Some interesting things are staring me in the mug. First, the DJIA (+61) has gained back over one half of Friday's selloff and the market breath on the NYSE is +150 and NAZ is +40.

The financials, metals and oils are acting well but the techs, semis, homies and Volatility Indexes have no jig.

With the SPY pivot directly above, I am not getting a warm fuzzy feeling about the market ripping higher from here.

OPENING LOOK

The markets open a bit to the higher side with market internals basically flat. The winners this morning are Oils(+2 or 3%), Financials(+.8%) GS+1.3% on the Barrons mention and Metals (+1%).

The techs and Volatility Indexes are flattish and INTC is higher by almost 1% on the Lenny Dykstra recommendation on Bulls and Bears on Saturday(lol).

The SPY is trading up 25 cents at 129.8 below its daily Pivot Point which is 130.1. I think it will have a hard time getting through there but I will be watching closely.

WHAT ME WORRY?

Helene Meisler on realmoney has some interesting comments this morning about some of her technical concerns with the markets as they relate to new highs v new lows:

"I have been harping away, almost daily, about the lack of expansion in the number of stocks making new highs.

I have shown that chart here repeatedly so I will not show it again, although it did fail again on Friday morning.

I have also shown how the number of stocks making new lows continues to expand, not contract. Friday was no exception, as new lows rose once again. That too is not bullish. However, when we put the two together and plot them on a 10-day moving average, we can see a trend that has developed over time. That trend is one of lower highs as the market has risen. This translates into a market that is being carried higher by only a handful of stocks, not a vast majority.

Think of building a structure with Tinkertoys: the bigger the base, the sturdier the structure; the smaller the base, the shakier it is."

The point I would make is that, yes, this matters eventually, problem is I have no clue as to when eventually shows and I want to make some money while I wait. The money trade has been to buy the dips and selling the rips and until that stops working I will be doing just that.

4.09.2006

LINKS ARE US

2ND CHANCE

The IBB was mentioned the other day as a potential long or put sale and it has only gone down since. My "proprietary" indicators tell me that the price is now the most stretched it has been from its short term moving averages since early October. In addition the 2 day RSI is now under 1 so it is indeed even a better short term play now (lol) than just a few days ago.

VIX KIX


The VIX rose on Friday to 12.26 and is now about 7% above its 10 day SMA. The question: Is now the time to buy the SPY ETF? I am going to wait for Monday's morning action to guide me, but my guess is we still have some work on the downside. I would like to see the SPY come down to the 129 area and maybe then we get the double signal: VIX (110% above the 10 day SMA) and the 2 day RSI on the SPY below 10.

The Pivot Point for tomorrow is the 130 area and support is 128.8 with second support around 128. The weekly points are the same as the daily points for tomorrow because the range on Friday from high to low exceeded that of the entire week. If one would like more information on the Pivot Points, I recommend "A Complete Guide to Technical Trading Tactics."