5.19.2006

THE CLOSE


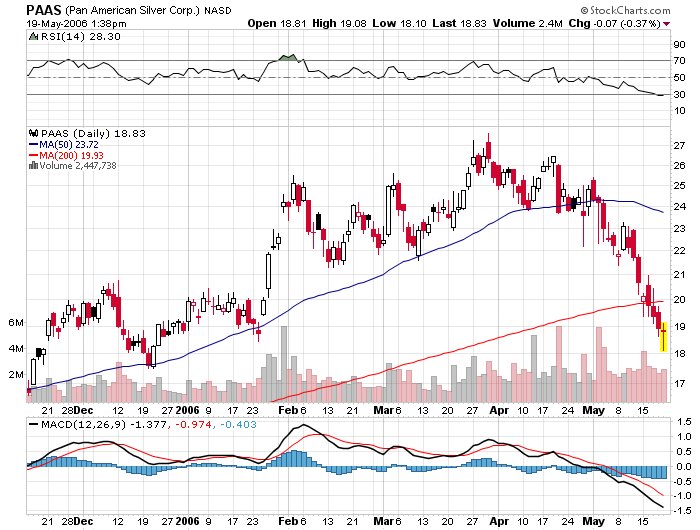
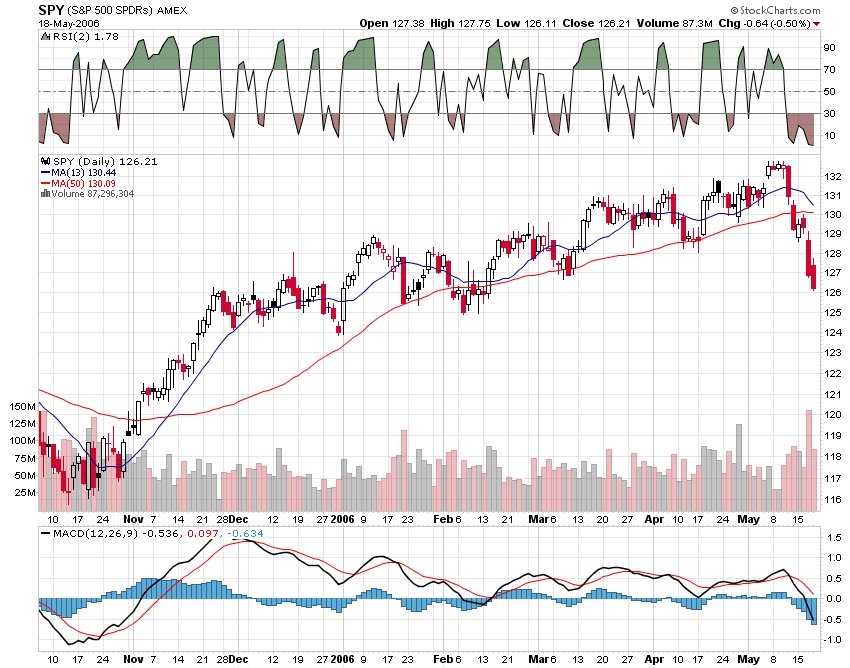
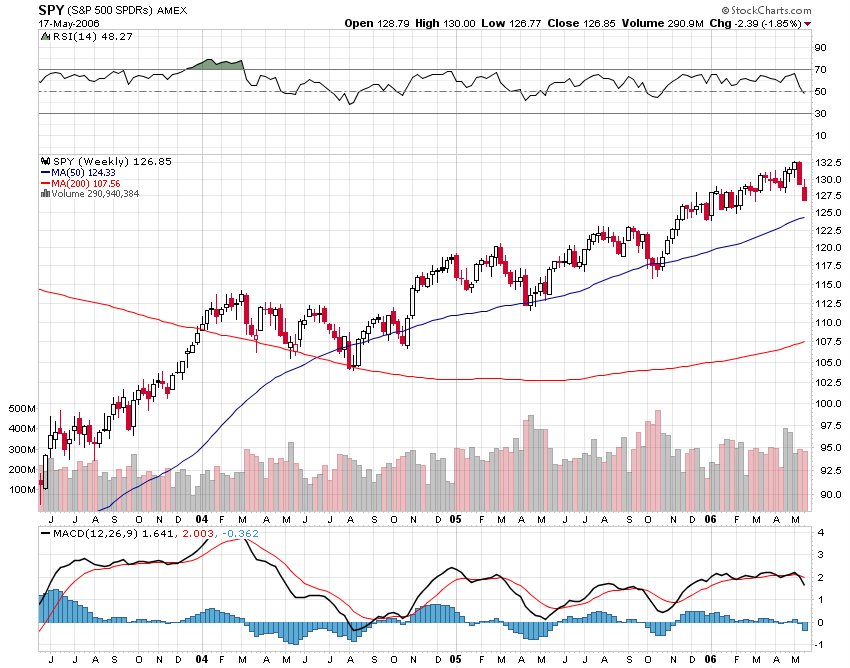
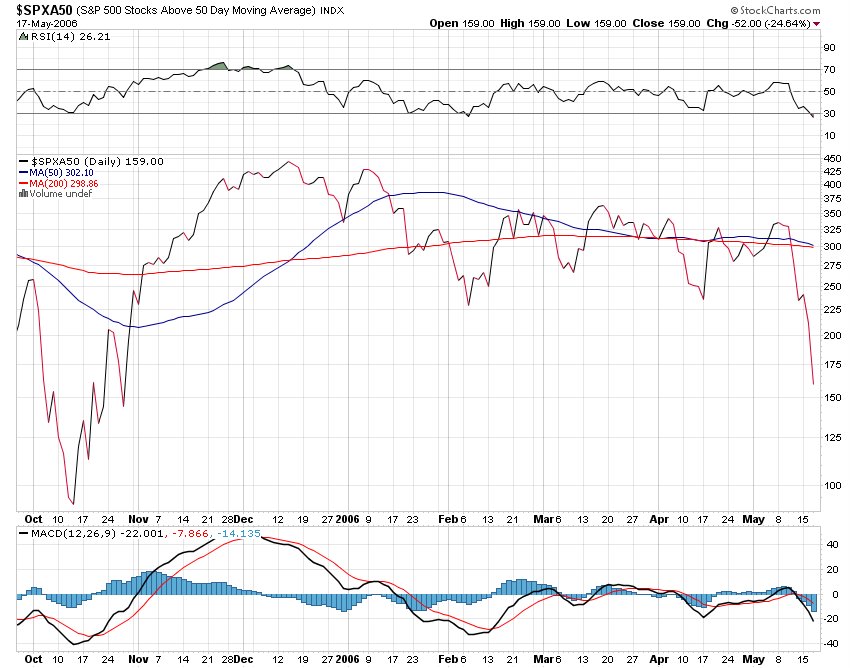
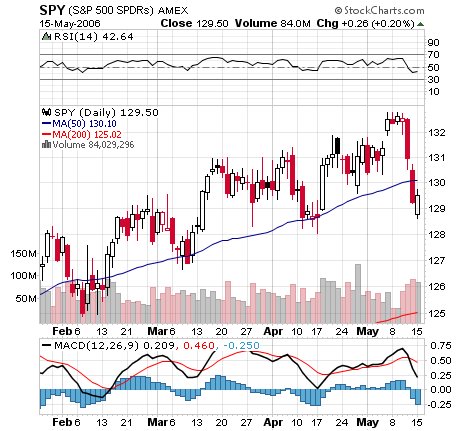
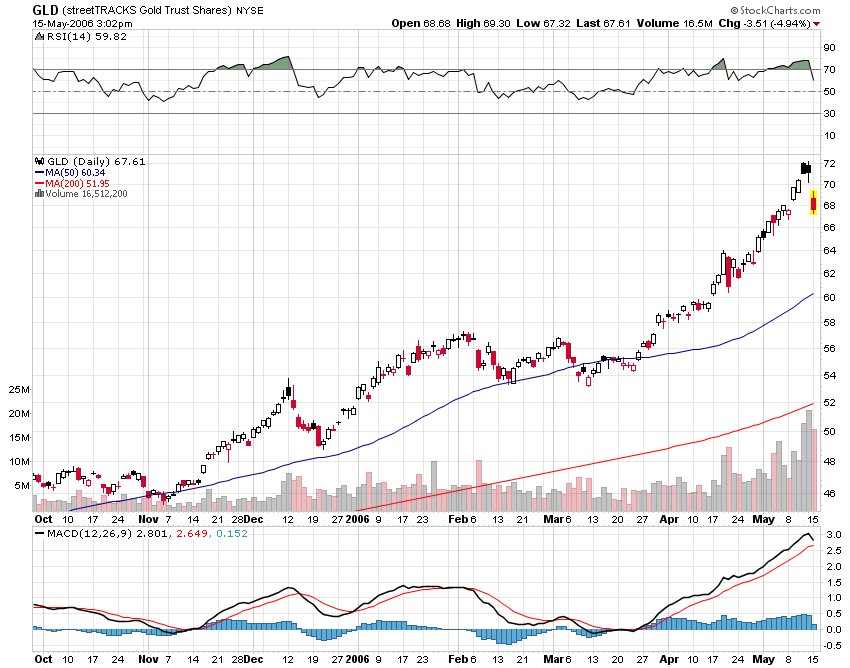
The good news is we did not crash into the close today unlike some other days this week. The SPX touched its 200 day SMA and rebounded and sold off and then rebounded again into the close. The Oils and the Metals also rebounded during the day and maybe, just maybe the worst is over for now, although I wouldn't be surprised by another probe lower next week in the major indexes.

The big winner on the day were the brokers and again that might be reassuring to the bulls. The SOX index was also up 3% although not the SMH due to the vastly different individual stock weightings.

One group that has been totally destroyed this year is the internet stocks such as YHOO EBAY AMZN etc. The HHH is the proxy and that ETF is way down from 70 to 50 and may bounce the best if the market can get some upside jig. Just food for thought.

OIH RUMBLINGS

The wacky day continues as the market internals again flip to the red after being all over the board. The DJIA has been up and down 45 points and it has changed on a dime a few times today. One rule I remember, although I don't remember from where, is that when the markets are very volatile, a change of direction is probably at hand. WELL WELCOME TO VOLATILITY as the range in SPY today is about $1.80 and the markets are basically flat.

Up above is a chart of the OIH which according to a very savvy chart reader is right at its trend line. I sold some puts here and will follow the trade closely as the OIH is very volatile. It is down about 27 points since May 11, so an oversold bounce may be the play here.

TECHNICALS- PAAS

I guess if you want to buy weakness and sell strength today is as good as any to buy PAAS. It is a favorite silver stock of several smart guys including Fleck and Laurie, who both write very good stuff for minyanville.com.

Is the bull market in GOLD SILVER COPPER etc over? I doubt it and I am stepping up here instead of waiting for Monday to buy.

The Volatility on the day continues as the major market indexes continue to trade all over the board. The market internals also trade anywhere and everywhere but as I type, they are 1,200 to the green. Also, note the brokers flying today, so maybe, they are giving the green light for a further rally as they were the first to signal a selloff weeks before the major indexes spit the bit.

WACKY


If you want volatility in equity markets, well just watch the screens. Not happy with the current prices, wait a while they will change. I was just watching as the DJIA was down 45 and now it is back to flat in a few moments. I can't remember the last time I saw this much volatility, but I can tell you that I am not trading, just watching.

I suspect lots of folks want to see the action around the 200 day SMA and we just barely missed it by 25 cents on the SPY. The markets seem to be bouncing back a bit here but I don't trust it as the market internals are not confirming higher prices with 1,500 more losers than gainers.

My strategy for the rest of the day should be to go to the New York Sports Club gym and work out, but I will sit and watch the action. Next week, however, may be a time to pick up some metal stocks such as PAAS and SSRI and even some oil stocks. For today, it looks like the fun is just beginning as the volatility is sure to pick up into the afternoon trade. And a final thought, what ever happened to Jim Cramer's new bull market from a few weeks ago?

OVERSOLD BOUNCE


I imagine SPX futures traders were salivating waiting to sell the gap up this morning. Market breath has moved to the red side as there are now 700 more stocks down than up.

The big losers on the day so far are the precious metal suckers with the HUI and XAU indexes both down over 2.5%. Oil stocks are holding up with both the XLE and OIH trading flat. The brokers and the bank stocks are trading a bit to the green but I am not making bets that will hold.

Truth be told, it looks like a flight to quality as the 10 year Bond is getting right back to the 5% level. The QQQQ is right back under where I sold them yesterday and I have no intention of buying anything (yet). GOOG is under 370 and it looks like Jimmy's $600 target will have to wait a while.

Both Dick Arms and Helene M on realmoney.com have columns up this morning telling us how oversold the markets are. Helene says her indicators show a turn in the markets for next week. Dick says we should bounce here on a short term basis. He said the same thing on Wednesday.

The next stop for the SPY looks to be the 200 day SMA which is not that far away at 125.6. I would guess we get there early next week and then the real fireworks will begin.

A WAY TO PLAY?

Lots of chatter today about AMD INTC and DELL as the latter finally decides to allow AMD chips into DELL servers. INTC is trading this morning at a three year low under 18 and AMD is up 8%.

A way to play may be to go long SMH with a stop in the 32 area as that ETF has just gotten crushed. The October low was the 32 level so it is a logical area of support. The biggest component of the SMH is TXN with INTC and AMAT 2 and 3. I am not advocating buying INTC even though it is the DOG of the DOW this year down over 25%, as all the analysts expect the EPS numbers to come down further. Buying a 20 PE stock with declining earnings is not a home run trade IMVHO.

ARE WE OVERSOLD ENOUGH


I don't need to write about how oversold the market are after yesterday afternoon's selloff. One can go here and here and find its all the same, the market is more oversold than it has been since blah blah blah.

Dr. Brett, on his site has this statistic:

"Finally, a total of 15% of NYSE issues are trading above their 20 day moving average. The last times we've had readings below 20% have been October, 2005; April, 2005; August, 2004; and May, 2004. Those were excellent intermediate-term buying opportunities."

What Dr. Brett doesn't mention is that there were statistics one could have gotten as early as Monday that indicated the markets were big time oversold. In other words, oversold has become even more oversold as the market has just gone straight down. The VIX above is now way oversold, more than it has been since, yes, blah blah blah

This morning, it looks like another shot for the shorts as the SPX Futures are up 6 which is a replay of yesterday morning. I expect the gap to be sold and we will see what happens from there. After all it is Friday and the markets rarely make much headway on Fridays.


5.18.2006

HOW LOW CAN WE GO


The question is how low are we going to go and the answer remains no one knows. The markets are oversold and were oversold last Friday so oversold can and does get more oversold. Rumors abound about a 50 basis point hike by the Fed at the next meeting and who knows what tomorrow's rumor may be.

The VIX continues to rip higher and is now more than 25% above its 10 day SMA. Usually market declines come to an end when the VIX goes higher than 5% above its 10 day SMA.
I also saw a note on Minyanville.com today that Dick Arms's ARMS index was more oversold on a 5 and 10 basis than it has been in a very long time. The 200 day SMA is not on this chart, but note that it is only about 70 cents away at 125.5. It will be interesting to see what happens when/if we get there. Back in October of 2005 we knifed through the 200 SMA and then went right back up and left it in the dust.

This market now has me worried as none of the buy signals have worked except for brief temporary bounces and I have sold many of the ETF's I recently bought. If the market acts better I can buy them back, but for right now capital preservation is key.


NOWHERE


The markets are very quiet this afternoon and I note the SPY just sits (trades) at its Pivot Point of 127.55. Not sure if this means that we will move higher this afternoon or not, but I have noticed that this pattern generally breaks in the direction of any slim jim or spike out of its tight range.

The internals point higher as there continues to be about 900 more winners than losers.

The homies, retailers and bonds are doing the best today with the 10 year now back down at 5.08%. I guess the sniff of inflation is slowly being debunked with the lower rates.

MSFT is higher (.30 cents) on the rumor of another special one time dividend and the QQQQ's are following, up 18 big cents on the news.

Everyone's favorite little gold stock is running into another problem today. KRY is lower by another 6% to 3.84 and it is making the guru's guru look unguru like as the stock probably fills the gap and completes the round trip.

On another note, one fellow who has been hot lately, Barry Ritholtz, has been buying SPY and DIA today after calling the top.

ACCOUNTABILITY?


I wrote the other day about a really dumb strategy Jim Cramer wrote about on his site. It was dumber than dumb and he has not written anything yet to follow up on this "go to" strategy.

If you don't remember here is what he said:

"Now, if you are trading like I described, you would have kicked out a lot of stuff at the opening -- faded it, so to speak. Now you have to begin to buy the stuff back. Oh, the pain! Seems so wrong. Doesn't the market look awful? Couldn't we be in for some difficulties because of expiration?"

That is what he wrote on Tuesday at 12:46 PM Eastern time when the SPY was trading at the 129.5 level or over $2.25 higher than where we now trade. Why is there no accountability, why doesn't he follow up on any of these dopey strategies? Why does the media treat him like he is the only guru who always gets it right?

Now you know why I and other bloggers hammer away at him. He is harmful to your financial well being.

THE BOUNCE


The markets have bounce on the open and the market internals are pointing north by north with 2,000 more issues higher than lower. A nice tell may also be the 10 year Bond being back at 5.1% way down from its close yesterday at 5.15 and higher during the day. Maybe the markets have overeacted to the inflation sniff or maybe the markets did not fall on the inflation worries.

Sectors outperforming include Small caps (+1%), retailers and brokers, both up 1%, and GLD also up 1%. The downer is the VIX as it has now plunged 7% making the fear worries a bit less worrisome.

How bout this for a scenario, everyone expects the markets to bounce and then of course every one will want to short into that rally. Maybe we get some good news and the shorts get blown out and we go right back to where we were last Wednesday. Wishful thinking?

RALLY TALK EVERYWHERE


Helen Meisler on realmoney.com has an interesting article this morning about all the oversold/rally chatter. I have a bit of a different take and here goes:

"Did you ever see so much discussion over whether that was capitulation or not? It might have ranked right up there with all the bubble talk from last week!

And don't forget how many times you heard how well tech acted yesterday.
Oh sure, Google (GOOG:Nasdaq) was up on the day. So was Broadcom (BRCM:Nasdaq) . And don't forget Apple (AAPL:Nasdaq) either!


Yet I keep hearing how bearish folks are on tech.

Where? Where are they bearish on tech?


If they were so bearish on tech, would they have been buying these stocks Wednesday? Nope, they would have been selling them.

We would have seen whooshes as we did with Home Depot (HD:NYSE) . But I didn't see anyone calling a bottom in Home Depot yesterday, did you?
Home Depot has fallen 10% in about five days, yet I don't see anyone screaming about how oversold this stock is like they are about tech. Do you see that volume surge in HD?

Now, look at all those tech stocks and tell me if you see a volume surge like that.
Oh wait, we see it in the Nasdaq 100 Trust (QQQQ:Nasdaq) . Aha, so that's why everyone is all excited about the capitulation.


Helene, now you have me confused, the QQQQ tech proxy has been heading lower since January when it made it high for the year. AAPL and GOOG have been spiraling down for months, long before the DJIA started heading lower last week. MSFT/INTC/BRCM/MRVL? Why do you say folks aren't bearish on tech. Check the SMH, that is not a pretty chart either. If folks are not bearish on tech, then they have lost a lot of money being bullish. Check the WINTEL quote, when was the last time those two were at that combined market value.


"As far as capitulation goes, we can say the VIX has surely gotten jumpy in that it has reached levels not seen since October. But to me, capitulation has always come when we break important levels, not when we hold on to them.

In this case, we have Nasdaq clinging to that 2200 level that everyone keeps citing and the DJIA clinging to 11,200. (And I cannot believe as I write this that folks are talking about capitulation with the DJIA carrying an 11 handle!) I also heard a debate over whether the S&P 500 would stop at 1240 or 1250.

When there is real capitulation and real fear in the market, talk of another 20 or 30 points down on the S&P when we've already fallen 60 seems odd.

Where are all those folks who start talking crashes?
Where are all those folks who start talking about the Dow under 10,000? I can't find them. Instead, I see a host of folks looking for a rally.


Oh wait, there is a saving grace: They all want to sell the rally. Gee, isn't that where we found ourselves Wednesday morning? Lot of good it did us after that CPI.

So we've determined it was not capitulation, and there surely was no fear. There was volatility, however, and that caused the spike in the VIX -- good news for the bulls. Also good news for the bulls is that the put/call ratio's total reading surged to a reading so high (152%) that I couldn't find another reading so high in my data.

The oscillator will not be oversold until next week (sometime between Monday and Wednesday). The 30-day moving average of the A/D line will be oversold tomorrow.

The number of stocks making new lows contracted on Nasdaq but expanded on the NYSE. I suppose the bulls will glom onto the Nasdaq and the bears will glom onto the NYSE.

So we're back to the same scenario we had yesterday morning: Rallies are not only possible but probable. After all, I am sure there is some precedent for the Nasdaq being down seven or eight days in a row (or is it nine now?) that someone will cite. I have been discussing the possibility of a rally next week, not this week, so I'm going to stick with that scenario.

If we get a rally this week, it will feel a bit premature."

Helene, I think the problem here is that the data is so readily available everyone knows when the VIX is overbought and when the PUT/CALL ratio is too high. Everyone has a guru on the web or a special site that tells them "yup, market is now officially oversold, time to buy." We have all kinds of data mining programs that tell everyone the probability of what will happen tomorrow based on what happened today, yesterday, last week, last month and last year. So the question now is how do we adapt, because I for one am nervous that just about everyone knows everything that you and I know.

5.17.2006

ANOTHER SIGNAL?

Looking at this chart, well it shows the same thing that all the other charts are showing, the markets are oversold and due for a bounce. This chart shows that the number of SPX stocks trading over their 50 day SMA is now down to 159, which is down from over 300 just a few days ago. If 60 more issues break down we are right back at the October lows on this indicator. At the rate we are falling, could happen tomorrow.

TECHNICALS -VIX


It is also nice to see that the VIX is back to the levels seen at the October 2005 lows. Another bounce signal?

TECHNICALS - SPY

Nice chart on the SPY. Yikes; I checked my spreadsheet and the SPY is now the most stretched it has been from its 13 day SMA since, well, that number is not anywhere on my spreadsheet going back to 2004. April and October 2005 were close but not quite this far stretched.

I sold some stuff today and am still holding some ETF's that were bought into the carnage. I need the VIX/VXO/VXN sisters to get unstretched to unload more as they are all about 25% above their 10 day SMA's. It is scary out there and what happend to buy the fear and sell the greed. The fear appeared last week and it continues and like I said earlier today, oversold can get more oversold and more oversold and so on and so on.

NOT MUCH INSIGHT


I really don't have much too offer as the big question is how oversold can the markets get. The answer is more oversold. So we wait. Will the carnage end today? Wish I knew.

Market internals are about the worst seen in a long time as more than 3,700 more shares lower than higher. It is nice to see that the SPX and DJIA indexes are doing worse than the Naz, so maybe an indication of a turn.

The VIX is 2.4 points higher bringing it up to 15.75 and over 22% above its 10 day SMA. My gut tells me we will get a nice snapback rally, the only question is when and from what levels as lots of stocks were puked up today and the downside volume is trouncing the upside as capitulation seems near.

WHAT NEXT


The markets are looking ugly once again and is there any hope for all of the dopey longs expecting a bounce (since last Friday)?

The market facts continue to point to way oversold and the VIX is again back over its "MAGIC" 110% of its 10 day SMA number. The VXO is up 11% just today and is also giving the buy signal. I don't like to lose a lot of money and therefore if the SPY pierces the 128 number on a closing basis, I will probably bid farewell to my index longs and go to the sidelines. I can always buy back at 129 right?

The market internals are ugly red at 3,000 more losers than winners, the 10 year Bond is back to a yield of 5.18% and GOLD is back up over 690.

Crude is lower on the inventory numbers and the OIH is down a buck. The other green I see on my screen, surprisingly, is GOOG and SNDK. The brokers are getting hammered again as GS is back down under the 150 level (15*15= 225 anyone?) from 170 in late April. We probably should have taken notice as that group was the first to head lower a few weeks ago. Maybe they will give a hint of a market rebound sometime soon.

GLOOM?


Just as I finish writing about the futures being higher the inflation numbers come out and yikes, the markets think we may have a sniff of inflation.

On the realmoney.com site. two of their technical analysts come out with "we are oversold so we should rally" columns. Helene M and Dick Arms both expecting an oversold rally and I agree although I do not see it on my screens this morning (maybe the wash out we need).

Dick says:

"The markets are becoming oversold, which suggests that we will have a rally, at least in the short term. On the chart, I have shown the five-day moving average of the Arms Index in red and the 10-day moving average in blue. Above the two moving averages is the Dow industrials, for comparison. In addition, I have inserted three vertical blue lines. These lines pass though the current level of the moving averages, and the prior two times we have seen such extreme readings. As can be seen, such a reading on the five-day tends to come in on, or just a bit in advance of, a cyclical low. "

Because the market dropped so rapidly, the 10-day is not yet at as much of an extreme, but it is, nevertheless, approaching a level that usually coincides with a market low. The implication from both of these moving averages is that we are at, or very close to, a rally.

On the other hand, a great deal of technical damage has been done. Many averages, particularly the Nasdaq Composite, have broken important support levels. Moreover, we have seen heavy volume on declines, which is a bearish sign. Therefore, I'd advise only more aggressive traders to try to take advantage of the rally that the short-term Arms Index numbers are signaling."


I track the arms index on a daily basis and yes they are more oversold than they have been in a long time. Does that mean the market goes up?

MORNING BITS


Hard to believe that GOLD/SILVER/COPPER ripping higher this morning and equity futures right along with them. Note to CNBC, generally, when commodities go higher, the markets go higher (check the charts).

There is some great stuff by the bloggers this AM, and I suggest that everyone check out Ron Sen's take on the current state of the markets.

Trader Mike also has an interesting take on the current state of the tape.

Tom Herman, with some breaking news at the WSJ $ on fighting the IRS. Good stuff and yes if you go to the IRS appeals division, they will generally compromise on the tax owed. The reason being, (take it from a former IRS auditor), they want to close out the case and move on to the next one. Going to Tax Court is generally not what the IRS wants to do when they have differences with ordinary citizens, corporations a different story.

Do not forget that today is the OIL CROP report, so should be some interesting trading in the energy sector come 10:30 Eastern time.

5.16.2006

NOT A PRETTY PICTURE


The news that I did not want, a lower low on the number of stocks trading over their 50 day SMA. This does not bode well for the markets and I will be looking for exits on my ETF's if there is substantial weakness over the next few days.

UNEVENTFUL


The markets today were uneventful with the NAZ seeing the worst of the selling. The SPX and DIA were basically unchanged and there were slightly more advancing stocks than decliners.

In light of my recent decisions to buy ETF's into the recent market downturn, I am getting a bit nervous since the markets refuse to rally. They also do not go lower either so it appears the bulls and bears are duking it out. The problem with that scenario is that the oversold condition of the market will gradually slip away as the more the market churns, the more the oversold condition disappears.

The VIX has also drifted down signaling that the markets are calmer even though they are not higher.

The winners on the day are the drug/healthcare sectors and the Bonds, while GOOG and AAPL continue to perform miserably along with the NAZ index.

Maybe the home of the whopper will get us some upside jig shortly.

REALMONEY UPDATE


I was just reading through some of my updated feed stories and this one came up from Cramerica central:

"Now, if you are trading like I described, you would have kicked out a lot of stuff at the opening -- faded it, so to speak. Now you have to begin to buy the stuff back. Oh, the pain! Seems so wrong. Doesn't the market look awful? Couldn't we be in for some difficulties because of expiration?"

I would like to know who he thinks the audience is for this drivel. And my question to the King of Cramerica, If we sell off again this afternoon, am I supposed to buy or sell and what about tomorrow morning? I know a lot of traders/investors like Jim's stuff and criticize me for focusing on his nonsense, but this is just ridiculous and I wish he would ride off into the sunset and never be heard from again.

TECHNICALS --SPX

The markets continue to trade marginally lower with the internals a hair bearish with 250 more decliners than advancers. I am watching the 10 year Bond closely as the yield has gone back to 5.1% on the heels of the lower inflation numbers. The only other green on my screens are the SIL /GLD metal ETF's, drugs and the larger integrated oils with the service sector slightly red.

One clue of whether this market will break its bull trend is to watch if the percentage of SPX stocks trading above their 50 day SMA begins to break. As of yesterday, the recent lows have held at prior SPX lows (beginning of February and the middle of April). Just another tool in the box.

TECHNICALS- JDSU

Jimmy pulling the plug this morning on JDSU. Not sure if he is right, but I am sure that he loved it back in the middle of April when it was 35% higher. I wish I knew why he insists on getting folks "interested" in penny stocks. Unless your timing is immaculate, it is a tough game to play. Even Jim has a tough time with the penny stocks, witness KRY and JDSU and I am sure there are a boat load of others including those in the telecom group.

QUICK LOOK

The markets have opened modestly higher with the Semis (SMH) leading the way higher by about 1%. The IWM is also outperforming the bigger caps with a .7% increase compared to the .2% drip higher on the SPY.

Market internals are green with 1,200 more winners than losers.

Oils and metals are back to their old tricks of leading higher with the HUI and XAU both higher by 1% plus and the oils up about .5%.


AAPL was mentioned this AM as a top holding of DE SHAW and GOOG was mentioned as a major sell of DE SHAW and both are trading down this morning. All of the major brokers are trading higher and the banking index is trading mixed.

The plan for my day trading is to buy the dips and sell the rips and the EWJ mentioned earlier looks like a buy.

THE PIVOTS

I have not discussed the Pivot Points on the SPY lately as I have been writing about the short term buy signals. The Pivot Point on SPY is 129.3 and Initial Resistance is 130 and Second Resistance is 130.4. Support is back at the 128.8 level and hopefully it will not be seen for awhile.

I note that the Japanese markets have tanked over the last few days so there may be a trade in EWJ. I plan on watching that one closely and may enter it today as it seems quite stretched to the downside.

VIX REVERSAL

The VIX reversal all the bulls were looking for finally appeared yesterday afternoon and now the obvious question is will it stick. It is still 9% above its 10 day SMA and the jury is still out. My take, yes, we will begin the VIX drift lower, the market drift higher and CNBC will be yapping about all time highs on the DJIA some time in the middle of next week. We are only 270 DJIA points or two or three good days away.

There is lots of chatter this morning about the break in the RUSSELL 2K (IWM) - I am not that concerned about it, IWM had the best run so its had the biggest fall. Lots of traders like to focus on the exactness of the trendline line fit, but I rarely find that a good money making strategy. I like to step back and look if its an uptrend and how far stretched it may be from moving averages.

I bought some yesterday and anticipate holding until the Volatility indexes or RSI levels tell me its time to sell.

5.15.2006

KRY V GOLD


This is one of my final comments on Jim Cramer- "hey KRY is going up because GOLD is going up" - Eh I don't think so. And is that another GAP that has to fill on KRY?

TECHNICALS - OIH

The markets continue to laugh in the face of anyone who found a buy signal Thursday, Friday or today and it is becoming very discouraging to all us dip buyers. Tomorrow may be turnaround Tuesday but it seems like it could be a long time until tomorrow and who knows how low the markets will be when a bounce eventually comes.

The OIH is now down $6.5 and the selloff seems to be on par with the usual OIH selloffs that occurred at the end of December and the beginning of February. The smart trade at that time was to " buy the dip" and I suspect that will be the smart trade again. It seems that whenever the oil prices rally, CNBC yaps on and on about the unending demand for oil, and when oil prices tumble, CNBC blathers on about the dry up in demand.

My bet, and it is a bet, Oils will eventually get the spike to the $80/$90 level and that will be the time to sell. Where is T. Boone when I need him?

TECHNICALS - JOYG

The metals are getting crushed today but is this the pullback to buy? I suspect the answer is yes and the reasons have been stated many times; commodity cycles last a long time and this one only began about three years ago. JOYG looks good on this ugly pullback as its fundamentals are very strong, but I am waiting for some price stabilization.

The oil service sector also looks good here as the OIH is now about as oversold as it gets over a short term period as it is down $17 from a $170 high on Thursday. Again, I will wait for some price stabilization.

The market internals continue to underwhelm as there are still 1,800 more losers than winners in spite of a flat DIA and SPY. The Semis have given it up also as the SOX index is now down almost 1%. On the brightside, the 10 year Bond rate is back under 5.15% so maybe equities can get a bid on the heels of lower rates.

ITS ALL RELATIVE


As I stand aside for the moment and await some clarity from the market (sure), I note that Dr. Brett has another interesting take on the crashing markets (seems that way anyway).

Is the sky truly falling or are we just spoiled by the recent constant upward drift in equity prices? Here is Dr. Brett's take:


"SPY was down about 2.5% over the past two days, but suppose we measure price change in relative terms? Suppose we measure price change as a multiple of the median two-day change over the past 60 days?

In this low volatility environment, the median daily price change of the past 60 days has been .47%. For all of 2006, the markets median two-day change has been .57%. Compare that to the 1996-2006 median of 1.05% and the 2002 median of 1.53%. A drop of 2.5% over two days was only about 60% above average in 2002, but more than five times the present average (5.3 to be precise).

And maybe traders don't react to the absolute magnitude of price changes, just as they don't react to the absolute reading shown on a thermometer. Forty-five degrees in the dead of winter elicits a different response than it does in mid-summer. A 2.5% drop in a high volatility market may be a much more routine event--and elicit a far more moderate response--than a 2.5% drop in a low volatility market.


If we look at what happens to the market two days after a two-day decline of 2.5% or more, we learn that the average change is .32%, but the median change is only .14%--similar to average for the sample (78 up, 69 down).

If we look at what happens to the market after a two-day decline that is more than 5.3 times the average two-day price change, we have a sample of only four. All four were up two days later by an average of 2.63% and a median 2.48%. In relative terms, the market two-days later was up by an average multiple of 2.47 times its 60-day average change, which in the current market would amount to 1.18%.


My research overall suggests that market outcomes are more skewed--and potential trading edges larger--when we treat price changes in relative rather than absolute terms.

TradingMarkets has found that viewing other indicators--such as the VIX--in a relative light is far superior to dealing with absolute VIX values. The same may well be true for price--and for many other market indicators that show different averages and standard deviations from one market period to the next."

My take is that the move of the markets on Thursday and Friday seemed larger than they actually were because we were so spoiled by the recent non-volatile slow upward drift in equity prices. So a drop in the SPY from 133 to 129, a 4 point sell off, seems huge in light of recent volatility. Keep in mind that it was just last October when the SPY dropped from 123 to 116 over about a 10 day period. After that October selloff, we again had a slow upward drift in equity prices.

The VIX shot up to the 17 area in mid October at the height of the selloff and then dribbled back down to the 11/12 area. Today, the VIX hit its high of around 15 earlier this morning and now looks like it want to start the dribble lower again.

My thoughts are that the markets will settle down after it becomes apparent that a crash is not at hand and commodities will stabilize and we will again begin the slow drift up in equity and commodity prices and a slow drift down in the Volatility indexes. Been there, Done That?


TRUST A BOUNCE?


The markets appear to be stabilizing this morning although the ADV/DEC line is certaintly skewed to the red with about 2,400 more losers than winners.

The obvious losers today are the metals and the oils with the OIH down another $4 as I type. The HUI and the XAU are both down 5% and the winner on the day is the SOX index, which is up .75%. The finanicals have also flipped moderately green and our old favorite JOYG is down another 6.5% as it participates in the metals drubbing.

I just wonder if the buyers will step up today if they see it is indeed not BLACK MONDAY.

My plan of action for now is too watch and look for stabilization in the market internals, the biotech stocks, the semis and the oils.