4.07.2006

OUT FOR THE DAY BACK MONDAY

4.06.2006

TO THE POINT / THE REAL DEAL


It has been a busy day here at Shark HQ with the mad monkey on KRY, the news of the Presidential leak, Billy Wagner blowing his first Enter Sandman save, Vijay leading the Masters and the SPY closing at the Pivot Point.

The winning sectors today were Big Cap Tech(QQQQ) AAPL, Semis(SMH), Brokers(GS) and Internets (HHH). The losers were Homies(HGX), Reits(IYR), Biotechs (IBB) and Drugs(PPH).

The internals finished the day at 600 to the red as they never confirmed when the markets turned higher.

Our Volatility friends also fell off after rising in the morning. They are not near any signals and we wait for the lift that never seems to come.

Tomorrows Point on the SPY for those trading is 130.75, with Support and Resistance at 131.25 and 130.2 respectively. I will not be trading as I will be away from the turret until Monday.

STOP TRADING NOW

Jimmy, the mad monkey, comes out and says "the big money is made buying weakness and selling strength, one of the reasons I like the biotechs here, " if this is so Mr. Monkey, why are just about all of your market recommendations trading at or near their 52 week highs when you say to buy them? The answer; never mind, or as long as I make a lot of market predictions and forecasts many will be correct and that will be good enough to silence the critics.

Jimmy, is that why you have recommended 702 stocks since July 28, 2005? DEFINITELY. Thanks Jimmy.

HERE WE GO AGAIN

The market continues to act well as it digested the Presidential Leak sell off (according to CNBC anyway) in a matter of minutes.

The SPY got back to 131.21 and is now back under 131 at 130.88. The resistance at 131 seems like a brick wall and with the market internals never confirming, I expect more churning ahead.

The QQQQ is trading better and had reached the 42.9 level this morning, but has now backed down to 42.8.

The Metals, Internets and Semis are the leading sectors. The Biotech sector, which has been weak for weeks, is trailing again today with the interest rate sectors such as housing and Reits also bringing up the rear thanks to the rise in the 10 Year Bond which is hanging tough at the 4.9 % range.

The Volatility Indexes have rolled back over and any thoughts about VIX teenager has again been become a distant memory (for today anyway).

THE DOG ATE MY HOMEWORK


Last night on Mad Money, Jimmy made the selection of KRY for his viewers and loyal followers. My thanks to Adam at the Daily Option Report for reminding me of this selection. Jimmy's reasons stated for likeing the stock was demand for precious metals from the BRIC countries was strong and political issues in Venezuela may be changing for the better. So as an investor/trader, I decided to do some homework on this one because it sounded odd for someone like our Jimmy to recommend a risky gold stock whose operations are largely mineral concessions that are owned or controlled in Venezuela.

I did not want to spend hours and hours on this project, so I went to the company website and found the latest reports. The major information obtained from the filings are as follows:

The company as of March 27, 2006 had 220,837,259 shs outstanding including options and warrants to purchase about another 20,000,000 -yielding a market value (market cap) of over $1,000,000,000.

In 2005, the companies Revenues totaled $25,000,000 which was up 23% from the $20,000,000 in the prior year. The company attributed the revenue increase to a 12% increase in production and 11% to the increase in the price of gold. That gives the company a multiple of 40x - yes, correct the company is now selling at 40 times sales- not 40 times earnings but 40 times sales. There are no earnings as the companies net loss for the year was about $45,000,000.

At December 31, 2005, the Company had a book value of approximately $130,000,000 and is therefore trading at 8 times book value with huge shareholder deficits.

The company had capital expenditures in 2005 of $94.4 million or about 4 times sales.

The company has a section in its financial report called Liquidity and Capital Resources- The information provided was as follows "the companies principal sources of liquidity have been equity and debt financing. The company does not expect to generate positive cash flow until the Las Cristinas project is operating at full capacity. The company forecasts cash requirements of approximately $275,000,000 through the first quarter of 2008. The company intends to fund this overall requirement with existing cash and from a combination of limited resource project debt financing, and other forms of public market debt and equity financing. "

The company identifies the following as a country risk- The companies principal properties are located in Venezuela and as such the Company may be affected by political or economic instabilities. The risks associated with carrying on business in Venezuela include, but are not limited to civil unrest, terrorism, military repression, extreme fluctuations in currency exchange rates and high rates of inflation.

The bottom line is that this company has spent much of its trading life as a penny stock under 2 bucks. It is obvious that they will continually issue stock and debt to fund losses, probably never be profitable and eventually trade at zero unless it becomes delisted due to political issues or lack of funding. Why someone goes on national television and recommends something like this to viewers is beyond comprehension.


NOON UPDATE

The market internals have shown the way again as the early morning flat markets have now given way. The internals are now 1,800 to the red and the SP500 is lower by 8 and the NAZ is lower by 11.

The best performing sector today surprisingly is the Semis. The worst performing sectors are the Homies, Drugs and Oils. The 10 Year Bond yield of 4.9% may now be scaring investors along with all those overbought readings (2 day RSI of over 97) on the SPY and the QQQQ. Did I just hear that Bill Griffith was attributing the selloff to the Scooter Libby/ President Bush leak? They have go to be kidding. If so, why are the Semis up and why is AAPL and GOOG higher. I guess they are unaffected by presidential leaks.

The Volatility Sisters are "ripping" higher this morning and maybe we can get a buy signal for next week. The VIX buy signal would be an area north of the 12.6 area.

The first level of support on the SPY of 130.5 didn't hold and I didn't buy. The next area is down at 129 and I expect that level to be at least touched.

LEVELS

That 131 level on SPY has certaintly become a battleground as the Resistance level has not disappointed. The major market indexes (NAZ -2, SPX-2) are holding much better this morning than the market internals which are 1,150 to the red.

The sector movers are Metals and Oils higher with Homies and Fixed Income a bit lower.

I am watching the SPY and looking for a break down to the 130.5 area as a buying level (initial daily support).

My QQQQ's are now gone (42.66) as it is not in my book to keep them with the 2 day RSI nearing the 100 level.

TECHNICALS QQQQ


The NAZDAQ 100 Index (QQQQ), has been very strong of late but may be getting set for a pullback. The 2 day RSI is currently registering a 97 rating which is an extreme and usually signifies a sell or a short signal. I have no intention of shorting at this time, but if I see the market internals weaken I will be out of this ETF completely.

Where would I buy it back? The old resistance for the QQQQ was the 42 area and that may now be a good entry point. One note of caution and that is that next week is the beginning of the earnings season and all the good news may be priced into stocks.

TECHNICALS - CIB

CIB the big Columbia bank acts great as the strong uptrend continues. The stock has an IBD EPS of 95 and a RS of 94 and it is ranked the best in its group by IBD. It pulled back a bit yesterday as its 2 day RSI closed in the 25 area and I added to my position. The strategy of buying pullbacks in strong uptrending stocks has been a great strategy in this market environment.

4.05.2006

THE CLOSE

Here we go again, all the CNBC blather about new highs yadda yadda yadda. Credit to Pisani for mentioning that we really have not gone anywhere in a while so don't be to excited.

The SPY shockingly closed right at 131- the Pivot Point resistance on the day. Today was the first time in the last 12 days that the actual SPY pivot was not touched. I bet that the streak starts again tomorrow with the pivot at 130.9. Also, please be careful as the 2 day RSI of the SPY is now at 94. History tells us its not a good time to buy equities for short term gains regardless of what some TV guys may be screaming.

The best performing sectors today were Homies/Reits ( thanks to bonds getting a bid 4.84%), Big Cap Tech and Semis, Oils, Metals and AAPL. The market internals were fairly tame only 240 more winners than losers on the NAZ. Our old friends, the Volatility Sisters have really done nothing lately and have not given any signals in weeks. Of course the markets have not moved much in weeks either.

STOP TRADING NOW


Jimmy loves SHLD(137.48) and CNXT(3.78) for the CNBC Maserati contest- I will pass on those for now but they are in the system for Cramer tracking.

Speaking of Cramer tracking, one of my best performing individual stocks lately is VLO. I have been in and out of the stock many times but have been in for a while now. I did a "mon back" back in the middle of February when Jimmy said this about VLO:

"Ah, I see, here we go: the hobgoblin of consistency. Perhaps I changed my tune because four weeks ago, Valero was making a ton of money refining gasoline, and in the last four weeks, refining margins have completely and totally collapsed.

I mean like completely and totally. Like just disappeared.

And you wondered why for many years refiners had the lowest multiples of any business except steel. Margins can collapse in a heartbeat. I am sure Valero is losing money on every gallon of oil it sells in California.

In these situations, earnings that might have been $10 go to $4. A stock that sold at 5 times earnings now sells at 12 times earnings. All that garbage about the refinery shortage and "no new refinery in 27 years" doesn't buy you a warm bucket of spit.
Of course, refiners are different from integrateds, which are different from drillers, which are different from drilling equipment companies. But the group still will trade monolithically off news in those, so accept the fact that the rough sledding will continue, particularly the more revenue they get from refining as a percentage of the whole.

Oh, and emailers: It's a tough game. Get used to it. I am not a joker, it's just that some businesses are funny in their own ways, especially refining. "


That was a bullseye on the low and look at that chart now. Thank you Voldemort. Sorry can't help it.

A LOOK BACK - SNDK

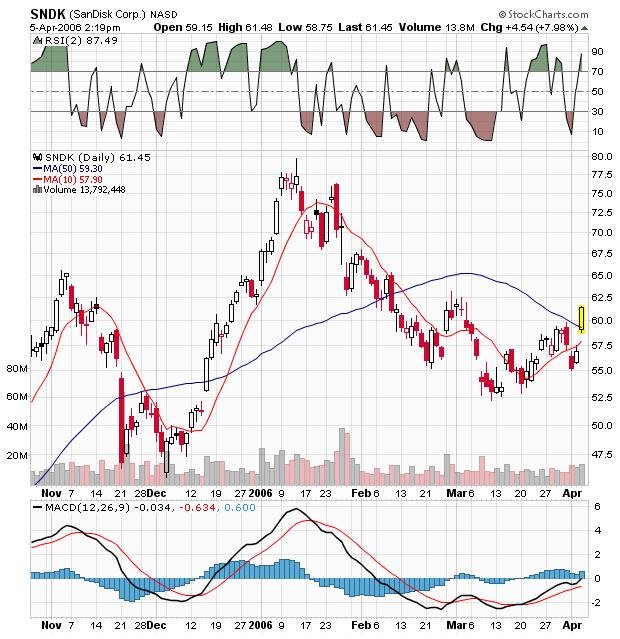
SNDK is up about 5 bucks today and I am taking some of mine off the table. It was mentioned back on March 23 in the mid 50's and it may run into some selling pressure at this level.

The SPY today has not touched its Pivot Point and probably won't as it keeps attacking the 131 level. I have chosen to sit this action out and wait for a better setup. Be aware that if we do bust through, the 131 level becomes support.

The sectors outperforming include Semis, Big Cap Tech, Homies, Oils, Retailers and Metals. I note the underperforming brokers and did Jimmy give the Kiss of Death to GS with his 225 price target. It had been going up just about every day, did he do it again?

The NAZ internals remain surprisingly blah as they are just 140 to the green. I just wonder if they may be telling us something about the close.

TECHNICALS- IBB

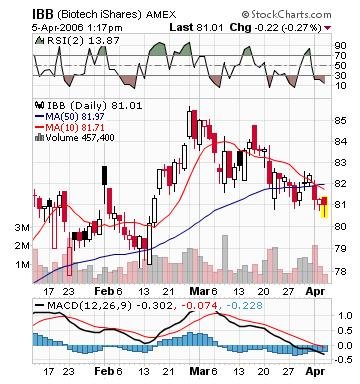
The ugly chart above of the IBB may represent a buying opportunity, or perhaps a put selling opportunity. Kudos to Adam at the Daily Option Report for pointing out the method and the ugly chart.

IBB is currently trading at a 2 day RSI of 14 and it's MACD Histogram is turning up under the zero line. It also may be catch up time for the Biotech stocks as they have recently underperformed the market.

If the IBB turns around and goes higher, the puts sold expire worthless and the premiums collected are kept. The method of put selling is an excellent way of getting long stock or an ETF and using as little capital as possible.

11:00 UPDATE


Couldn't resist updating here as the NAZ internals fade to red (neg 300) and the markets give up their green. I can't stress enough the "tell" of the internals, as they will rarely lead you astray.

The only sectors I see outperforming now are Homies ( on the lower yielding bonds), Metals and the Semis. Just about all the other sectors look about unchanged.

The SPY resistance held as usual and the next buying area looks to be the 130.2 Pivot area.

A LONG TERM INVESTMENT

That is a long term chart of Medtronic (MDT), the medical device giant that is the world's largest maker of implantable medical devices, with products that treat heart and neurological disorders, as well as spinal conditions and diabetes.

The company was highlighted yesterday in Barron's Online and I think they are exactly correct about the long term prospects for the company.

The stock is down about 14% since hitting a five year high in January. According to Barron's," the stock slumped amid growing fears about Medicare reimbursement rates for medical devices, especially pager sized heart devices called implantable cardioverter defibrillators (ICDs), Medtronics biggest seller."

Michael Barr, an analyst with Victory Capital Management was quoted in the article saying "Investors should take advantage of the weakness right now because they are not going to see opportunities like this come along all that often" Barr went on to say "I have a hard time understanding why the market has questioned Medtronic's growth rate to this extent, they have a very deep pipeline, and their profits are growing almost twice as fast as the SP 500."

There were other analysts interviewed in the article (all bullish) but I get the point and will be buying.


OPENING LOOK


The market opens a bit higher with market internals about 600 to the green. Leading sectors today are Metals (+1%) Reits (+.6%)reacting to the Ten Year Bond being back down to 4.84% and Tech with the Sox (+1%), Oils are trading a bit lower with the big oil inventory numbers coming out at 10:30 EST. AAPL +6% and SNDK +4.6% are leading the Big Cap tech group.

The SPY has already hit its head at 130.9, just a tad under the 131 resistance level. The NAZ internals showing only about 150 to the green are giving me a bit of a pause here. If the Naz internals do not improve I will either sit this one out or wait for lower prices to buy.

TECHNICALS - SPY


Here we go again. Last afternoon the SPY closed at 130.56, the Pivot Point Resistance level for the day. If one looks at the chart, one can see that the SPY never goes higher or lower, it just oscillates between the 129.3 and 131 areas. It has been in this tight range since March 17 (13 trading sessions) and I expect it to continue into next week when earnings season hits.

Buying near support and selling near resistance has been a money trade since this trading range began. Todays Pivot Point is 130.2, Support is 129.7 and Resistance is not surprisingly at the 131 area.

4.04.2006

THE CLOSE

Just a brief final note as the markets close green with the best market tell, the internals hanging in with about 475 total to the green.

The Pivot on the SPY for tomorrow is in the 130.15 area and since the pivot seems to get touched every day lately, I sold all of my SPY's near the close and will look to reload tomorrow at lower prices. I will continue to use the strategy of buying lower and selling higher as that appears to be the strategy to use in this rangebound market.

The financials did very well as did oils and metals, trading to the red were AAPL and the Semis. The NAZ surprisingly is the trailing index of late.

I recommend my pal Adam Warner's take on Cramer at The Daily Option Report. His analysis is a must read.

STOP TRADING


Leading sectors remain Brokers, Banks, Retailers and Oils. The market internals remain split with NYSE internals 650 green and NAZ 150 to the good side. AAPL and the Semis trade in the red while GOOG is 12 beaners to the green.

The 10 Year Bond trades back to the 4.87% range and this bears watching if one wishes to navigate the markets profitably.


SPY resistance of 130.55 works nicely as the markets run into the initial wall. Keep in mind that major resistance remains overhead in the 131 area.

In addition, Voldemort strikes again and gives us the anticipated top/fade. I don't know how anyone could be so good at finding tops and bottoms.

The stock picks of the day by the above mentioned Voldemort finds him bullish on FWLT (75.72) CFC (37.09) APD (66.62) and GS(161.13). We will track these and see how he does.

1:30 UPDATE

The BANKS and BROKERS are leading the markets higher this PM with some help from the Oils and the Retailers. The losers are AAPL DRGs and REITS. The internals are about 500 to the green with NAZ internals still flat. The bad news is the Ten year Bond is doing an about face back to 4.87% again.

Looks like Jimmy is getting excited about the markets again as the SPY trades to 130.45. He spews out his " Midday Rally Should be Hard to Stop " at 12:45 EST setting us up for another turnaround. Probably, but first, we probably get to the 130.55 resistance point. After that the Cramer fade will probably kick in.

TRADING THE VOLATILITY

The market has inched higher this morning as the Techs, Banks, Brokers and Small caps lead. The metals are under a bit of pressure and GOOG is 10 to the good side. The NYSE internals are 500 to the green and the NAZ are flat.

The SPY is now sitting a bit above the 130 Pivot and anyone (me) who bought the dip at the 129.7 area is now up about 4 S and P points in a quick morning trade. BUY THE DIPS SELL THE RIPS. Until further notice that is the action in the markets.

PAY NO ATTENTION TO THE MAN BEHIND THE CURTAIN WHO LOVES EM HIGHER AND HATES EM LOWER.

The question now is can we get any jig beyond here. Initial resistance on the SPY is at the 130.55 area and we may get there. I would trail gains closely as lately the market loves to fake and reverse.

TECHNICALS - TEN YEAR BOND(TNX)


One item that may be giving a little bid to stocks today is the 10 year Bond. It is now trading back to the 4.85 area after approaching 4.90 yesterday. Stocks may get a lift if the bonds start heading back down to the 4.75/4.8 area.

OPENING THOUGHTS

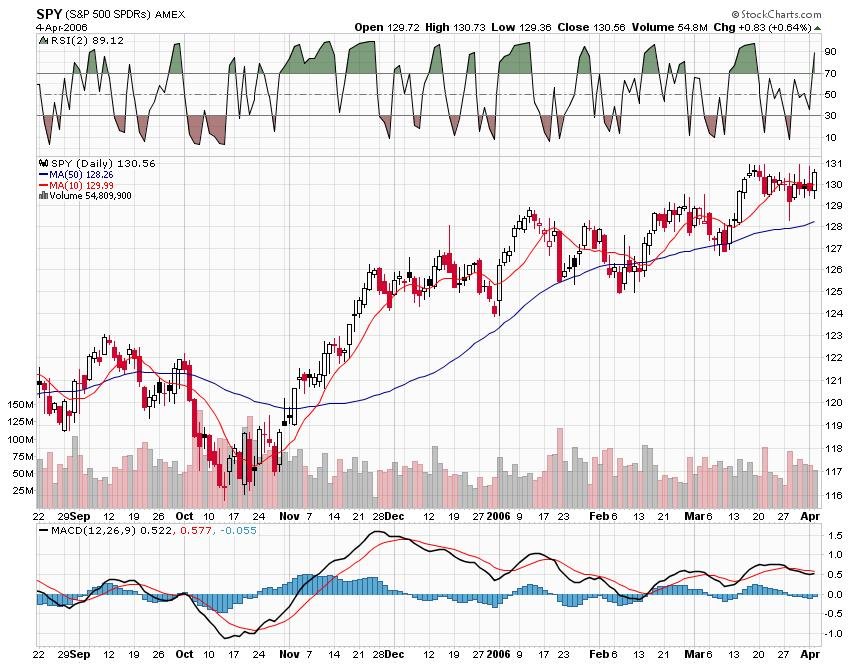
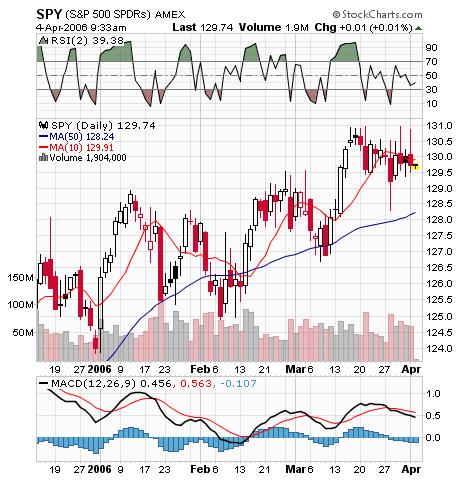
Initial thoughts on the day: Buy the pullbacks - The Pivot on the SPY is the 130 area with support at 129.2. My game plan will be to buy the dips and flip stock as it approaches the 130 area.

Last weeks lows in the 129 area is another level of support to watch. A slew of resistance remains in the area of the recent highs in the 131 area.

The market internals have rapidly improved to green on the NYSE and flattish on the NAZ- I continue to be in the buy the dip mode until it stops working.

The sectors outperforming include Oils, Techs, Banks, Metals, Brokers, Retailers, Semis and GOOG. The laggards are AAPL, Bios and Consumers. The Volatility indexes are flat.

The technique of buying when stocks are ripping higher has not worked well and my guess is that it will continue to be a troublesome trading method.

4.03.2006

TECHNICALS - JOYG

Not sure if this was the stock of the day, but it was the stock of my day. The stock is now over 63 and due for a pullback (which should be bought). I intend to trail a stop on it and will probably be out tomorrow or the next day.

I will also look to buy back in the high 5o's area. It has been a great stock and I expect it will continue its northerly trajectory.

THE CLOSE


The markets closed pretty ugly and at the lows of the day.

The best performing sector on the day was the Sox and about everything else closed a bit in the red. The internals did close at 1,000 to the darkside.

I bought some SPY at the close and any run up to the 130 area will be a sell sign unless I see the internals do an about face. The 2 day RSI is now back down to the 25 area and if the SPY goes lower I will buy more on the way down. I know its a better strategy than top ticking the market and getting excited on the way up and depressed on the way down.

The one thing that is beginning to bother me however, is that the charts are starting to look like the start of downtrends. That is why there are stops and the markets do not go straight down (or straight up).

STOP TRADING NOW

Maybe its time to change the header to "oops I did it again" as Jimmy top ticked the market by proclaiming "12 reasons to love the market."

The DJIA is now off 100 points from its high of the day and the QQQQ is flat. The market internals were quite the tell today as they were never strong and now show 1,000 more issues losing than winning.

The oil patch is back to flat after ripping higher and Reits, Homies, Retail and Bios are all trading ugly. GS and the brokers continue to trade well and eat up the ever present shorts.

The SPY story was told early as the 131 high from last week and todays secondary resistance at the 130.7 area was too stiff an area to break.

Tomorows SPY Pivot Point at the 130.15 area may be setting up for a nice trade to the long side.

1:30 LOOK


The markets are maintaining their morning strength but the fly in the ointment remains the market internals.

The NAZ internals are now 400 to the red while the NYSE internals are 500 to the green. Just a bit mystifying.

The Oils Metals and Semis are the outperforming sectors as the Homies Reits and Bios trail.

The Volatility Sisters are down a bit but no where near sell signals. The closest thing to a sell signal is coming from the QQQQ and SPY where there 2 day RSI levels are 86 and 89 respectively. Any more jig in those and I will be out of all my ETF trades.

BACK AT IT AGAIN


In the "you can't make it up department" the crowing rooster, Jimmy Cramer is out with this blog post this morning " a dozen reasons to love this market."

Jim changes as the prices change generally suggesting the market is going higher when it is higher and going lower when the market is indeed lower. That is not what I call helpful. I was so mystified by this method that I went back on his blog and looked for other recent market direction comments.

March 28 - The fed day blog entry of "Wait to buy until Wednesday." That was on the day the market was off hard on the fed announcement and the next day the market was up with the QQQQ closing at 41.92 vs the Tuesday fed day close at 41.14. That of course was a backwards call at best.

March 22- A blog entry called "market still skews toward selling" and on that day the QQQQ closed at 41.21. The QQQQ as I type is 42.32 or 2.7% higher.

March 17- The infamous blog entry called "forget the NAZ for now" and on that day the QQQQ closed at 41.45.

March 8 - A favorite entry called "no reason to trust this rally" when the QQQQ closed at 40.87 only 3.5% lower than the current QQQQ price and about equivalent to the 2006 NAZ gain for the first quarter. Another entry that day was called "can't pretend all's well."

March 6- With all the oil stocks selling off hard, one of Jim's blog entries was "Big oil has become to hard." On that day the OIH closed at 137.01 only about 14 points or more than 10% lower than todays price.


I stand by my methodology of buying lower and selling higher.

THE PIVOT TRADE


The Pivot Point trade from Friday is now up over a buck and the next area of resistance is the 130.7 area. Last week's high of 131+ may also come into play as a point of resistance. The Pivot of the 129.8 area was briefly hit and proved to be a nice entry point.

The internals have flipped to about 1k green and just about all of the major market sectors are now green. The biggest winners are the oils and metals, the biggest losers are the homie stocks (-.5%), and the hated REITS.

HEADS UP

The markets open and the market internals are quite telling- FLAT. The sticking point is that the NAZ internals and the Semi's are both flat to red.

Another tell that I am watching closely are the Small caps as the IWM opens lower.

The oils are ripping with the OIH up over 2 bucks, and the metal indexes ramping by 1.5%. The sectors lagging are the Homies,Bio's, Reits and Retailers. The 10 year Bond is now hovering just below the 4.9% mark and that may be putting a bit of a damper on the markets.

Two favorites that have been discussed here a few times, GWR and JOYG are both up over 3% and trading at their 52 week highs.

SPY PIVOT TRADE

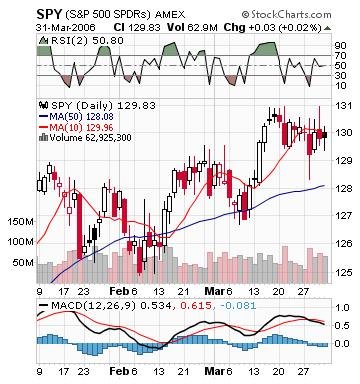
On Friday, I mentioned a high probability setup buying the SPY before the close on the assumption the Pivot Point (129.8) would be hit today.

A few moments before the close, the SPY started ripping higher and closed around the Pivot and now the trade is looking pretty good. Unfortunately, I started buying the SPY at the 129.45 area and was bidding for more but never got filled.

Presently the SPY is trading above 130 and my strategy is to watch the market internals for hints of the market's direction. If the internals start to break down, I will sell and look for a better buying opportunity. Keep in mind that the resistance today is about 130.25 so that may be a good area to sell if the markets lift further.

4.02.2006

PRE SOPRANOS RANDOMS