One of the first trading books I read, (at the end of the last century) was Dr. Alexander Elder's
TRADING FOR A LIVING. This is a terrific book for those who want to learn about technical indicators and trade the markets. Dr Elder's overall methodology is fairly simple;
identify the trend and buy or short pull backs or pull ups into the trend.
He also "developed " an indicator that I track daily called Elder-ray. This indicator identifies overbought and oversold markets by taking a moving average and applying something called BULL POWER and BEAR POWER to them. Bull power is calculated by subtracting the moving average from the high of the daily (or any other period) bar and bear power is computed by subtracting the moving average from the low of the bar. The general rule is that if Bull Power is negative and rising and the trend is up, it is a buying opportunity. If Bear power is positive and falling and the trend is down, it is a shorting opportunity.
I monitor bull and bear power on a daily basis using a 13 day SMA and I find that if they are both positive, the markets are generally overbought, and if they are negative, the markets are generally oversold.
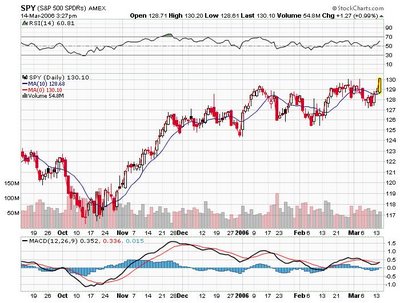
Today on the SPY, the BULL Power and the BEAR Power are as high as they have been (+2.5 bull and +1.85 bear) since January 11, 2006. If you check the charts you will find that was an excellent time to sell the SPY.
I use this indicator in conjunction with the Volatility Sisters, the 2 day RSI and a moving average of the advance/decline lines.
Presently the 2 day RSI on the SPY is 97, the highest it has been since January 10 and the internals are the most overbought they have been also since January 10.
Sounds like several indicators have aligned and the market is going to have trouble moving higher from these levels. Note the crummy action today on the NAZDAQ and the Semiconductors.
 In light of the first day of the new Bull Market, I want everyone to party tonite like its, yes, 1999.


